Shared course · by demo

Reading a company's financial statements

Open an annual report and understand the income statement, balance sheet and cash flow statement well enough to judge whether a business is healthy.

lessons
53
to learn
15h 28m
questions
163
written
53/53
Start reading BeginnerEnglish

The path

WrittenNot yet

  1. What the three statements are and why they exist25 min4 questions
  2. Accrual accounting in plain terms20 min4 questions
  3. The accounting equation15 min3 questions
  4. The three statements at a glance10 min3 questions
  5. Reporting period and fiscal year10 min4 questions
  6. Who reads each statement10 min3 questions
  7. Reading the income statement top to bottom35 min3 questions
  8. Revenue recognition pitfalls25 min3 questions

Lesson 1

What the three statements are and why they exist

You will be able to name the income statement, balance sheet and cash flow statement and describe what question each one answers. Covers the reporting period, the idea of accrual accounting versus cash, and the stakeholders who rely on each statement. Prevents the belief that profit equals cash in the bank.

25 min4 assessments

You walk into a doctor's office. The doctor checks your pulse, your temperature, and your blood pressure. Three different numbers, each telling something different about your health.

A company's annual report works the same way. It contains three separate financial statements, each answering a different question about the business:

  • The income statement answers: Did the company make a profit during the period?
  • The balance sheet answers: What does the company own and owe right now?
  • The cash flow statement answers: Where did cash come from and where did it go?

These statements exist because a single number can't capture the whole picture. The reporting period — typically a year or a quarter — is the window of time the statements cover. The income statement and cash flow statement describe flows over that period, while the balance sheet is a snapshot at the end of the period.

Crucially, the income statement uses accrual accounting: revenue is recorded when it's earned, not when cash arrives. Expenses are matched to the revenue they helped generate. This means profit shown on the income statement is not the same as cash in the bank. The cash flow statement fills that gap.

Different stakeholders rely on different statements. Investors focus on the income statement for profitability trends. Banks look at the balance sheet for solvency. Managers use the cash flow statement to plan liquidity. Understanding what each statement tells you is the first step to making sense of any annual report.

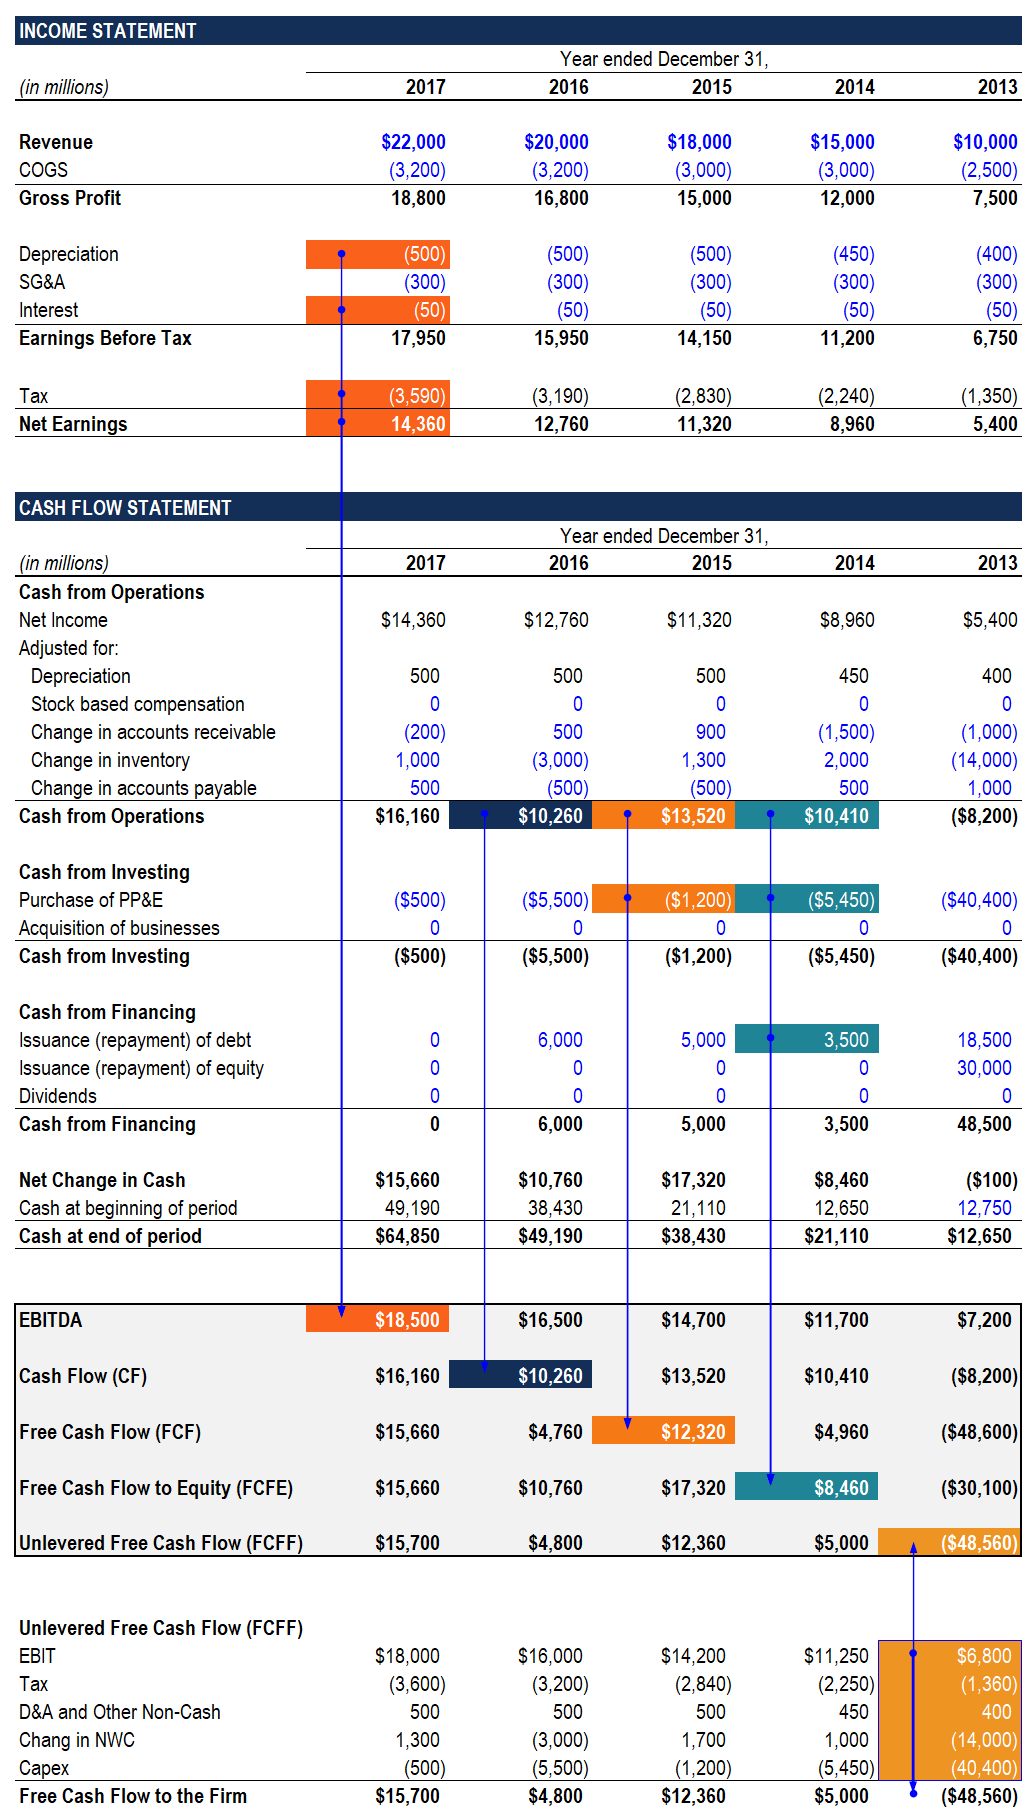
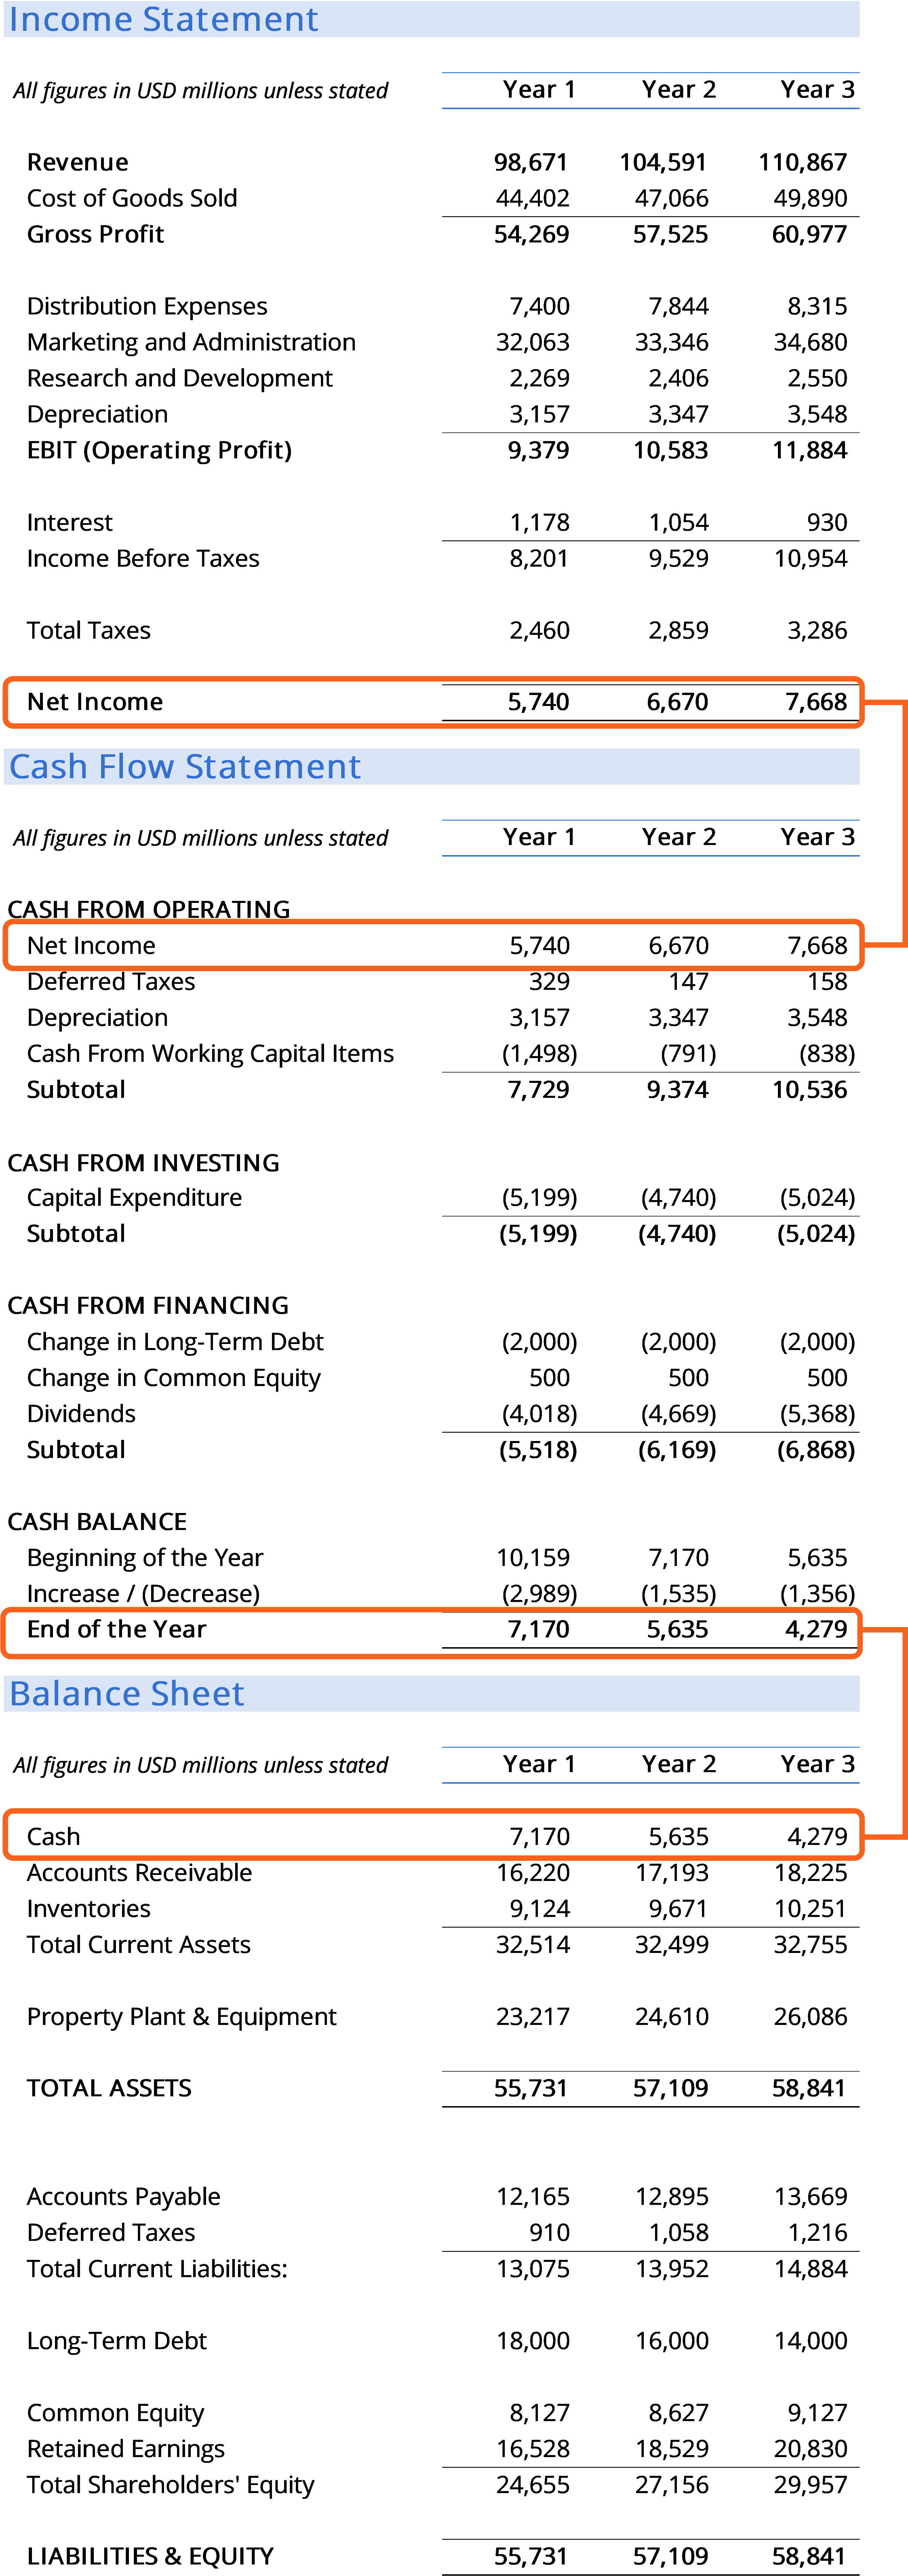
How the three financial statements relate. The income statement feeds net income to the balance sheet (retained earnings) and cash flow statement. The cash flow statement's ending cash updates the balance sheet's cash balance.

Analogy

Think of the three statements as a health report for a car. The income statement is like the fuel economy display: it tells you how efficiently the car ran over the last hour (profit). The balance sheet is like the dashboard gauges at a single moment: fuel level, oil pressure, battery voltage (assets and liabilities). The cash flow statement is like the odometer and trip meter combined: it shows every mile driven and every gallon used (cash movements).

Where the analogy breaks down

People mistakenly think that if the fuel economy display shows 30 mpg, the tank must have plenty of fuel. But the car could have run out of gas because the tank was nearly empty. Similarly, profit doesn't mean cash is available — the company may have spent cash on new equipment or lent it to customers, and the cash flow statement reveals the real liquidity.

Common misconception

“Profit is the same as cash in the bank.”

We earn money and then we have it. If a company reports a profit, it must have more cash.

What is actually true

Under accrual accounting, revenue is recorded when earned, even if payment is due later. Expenses are recorded when incurred, even if not paid yet. So a company can show a profit on the income statement while its bank account is empty because customers haven't paid their invoices yet. The cash flow statement reveals the true liquidity.
Check yourself

Test your understanding of the three financial statements.

1Multiple choiceChecked instantly

Which financial statement shows a company's financial position at a specific point in time?

  • AIncome Statement
  • BBalance Sheet
  • CCash Flow Statement
  • DStatement of Retained Earnings
2Short answerMarked by AI

Explain why a company can report a profit on its income statement but have no cash in the bank. Refer to at least one specific accounting concept.

Graded on Identifies accrual accounting or credit sales as the reason · Explains the disconnect between profit and cash flow

3Short answerMarked by AI

A bank is considering lending money to a small business. Which financial statement would be most useful to the bank, and why?

Graded on Identifies the most relevant statement and justifies the choice · Considers the bank's perspective as a stakeholder

4EssayMarked by AI

Imagine you are an investor. Describe how you would use all three financial statements together to assess a company's health. Give a specific example of what you might look for in each statement.

Graded on Describes how each statement contributes to the overall assessment · Provides a concrete example for each statement · Explains how the statements complement each other

Lesson 2

Accrual accounting in plain terms

You will be able to explain why revenue is booked when earned, not when cash arrives, and why expenses are matched to the revenue they helped generate. Covers the matching principle, receivables, payables and prepayments. Prevents the error of treating the income statement like a bank statement.

20 min4 assessments

You already know the income statement, balance sheet and cash flow statement each answer a different question. Now you need to stop treating the income statement like a bank statement. A company that looks profitable on paper might be starved of cash, and a cash-rich company might be reporting a loss. The reason is accrual accounting.

Under accrual accounting, revenue is recorded when it is earned — when you have delivered the goods or service and the customer is obliged to pay — not when the cash lands in your bank account. Similarly, expenses are recorded when they are incurred to generate that revenue, not when the bill is paid. This is the matching principle: match the cost of earning revenue to the revenue itself in the same period.

Three common accrual adjustments keep the income statement honest:

  • Receivables: You delivered the work but haven't been paid yet. The income statement shows the revenue; the balance sheet shows an asset (accounts receivable). Later, when cash arrives, the asset converts to cash — no extra revenue.
  • Payables: You received a service or supply but haven't paid the invoice yet. The income statement shows the expense; the balance sheet shows a liability (accounts payable). Paying later reduces cash and removes the liability.
  • Prepayments: You paid cash upfront for something that covers future periods (e.g., insurance premium). The balance sheet records an asset (prepaid expense) and releases a portion to the income statement as an expense each period.

These adjustments exist to give you a truer picture of performance in a given period, not to hide cash problems. A company can show a large profit while its cash is tied up in receivables, or show a loss while it has deferred revenue (cash received but not yet earned).

A single sale on credit: revenue appears in January (when earned), cash arrives in February, and the related expense is matched to January even though the supplier is paid in March.

Analogy

Think of a gym membership. You pay a full year's fee in January (cash leaves). But the gym's service — access to the facilities — is delivered over the next 12 months. If the gym treated the January cash as all revenue in January, its income statement would show a huge profit that month and losses the rest of the year, even though it is doing the same work every month. Accrual accounting spreads that January cash across the year as 'unearned revenue' (a liability) and releases it to revenue each month as the service is provided. The income statement now shows a steady monthly picture of the gym's performance.

Now consider a software company that signs a big annual contract in December but hasn't delivered the software yet. The customer pays upfront. Under accrual, the cash is not revenue — it's deferred revenue. The income statement shows zero revenue from that deal until the software is delivered. This prevents the company from looking profitable before it has earned the money.

Where the analogy breaks down

The analogy breaks down when cash flow is the only thing that matters — for example, a startup that must pay salaries next week. Accrual profit does not pay the rent; cash does. The income statement shows whether the business model works; the cash flow statement shows whether the company survives.

Common misconception

“If the company hasn't received the cash yet, it's not revenue.”

In everyday life, you count money when it hits your pocket. A business that hasn't been paid feels like it hasn't earned anything yet.

What is actually true

Under accrual accounting, revenue is recognized when the company has fulfilled its obligation to the customer — delivered the product or service — and the customer is legally required to pay. The cash may arrive later. Recording revenue at delivery gives a more accurate picture of the period's economic activity, not just its cash movements.

A consulting engagement on credit

Scenario: Your consultancy completes a $10,000 project for a client in March. You send an invoice with 30-day terms. The client pays $10,000 in April. You also incurred $3,000 in subcontractor costs in March, which you pay in May.

Accrual treatment:

  • March income statement: Revenue $10,000, Expense $3,000 → Profit $7,000.
  • March balance sheet: Accounts Receivable $10,000 (asset), Accounts Payable $3,000 (liability).
  • April cash receipt: Cash +$10,000, Accounts Receivable -$10,000 → no income effect.
  • May cash payment: Cash -$3,000, Accounts Payable -$3,000 → no income effect.

Cash basis treatment:

  • March: No revenue, no expense → profit $0.
  • April: Revenue $10,000, no expense → profit $10,000.
  • May: Expense $3,000 → profit -$3,000.

Accrual shows the true profit of $7,000 in the period the work was done. Cash basis shows a misleading $0, then $10,000, then -$3,000.

Check yourself

Check your understanding of accrual accounting.

1Multiple choiceChecked instantly

Under the matching principle, when should a company record the cost of goods sold for inventory that was sold in January but paid for in February?

  • AIn January, when the sale is recognized
  • BIn February, when the cash is paid
  • CSpread equally across January and February
  • DIn the month the inventory was purchased, regardless of sale
2Short answerMarked by AI

A customer pays $1,200 in December for a 12-month software subscription that starts in January. How does the company record this in December under accrual accounting?

3Short answerMarked by AI

A landscaping company mows a lawn in April and sends an invoice for $200. The customer pays in May. The company also used $50 worth of fuel in April, which it pays for in June. Under accrual accounting, what is the profit for April? Explain your reasoning.

Graded on Correct profit amount · Reasoning about revenue recognition · Reasoning about expense matching

4Short answerMarked by AI

A company reports a net profit of $500,000 for the year, yet its cash balance decreased by $200,000. Using what you know about accrual accounting, explain how this is possible. Name at least one specific accrual item that could cause this.

Graded on Identifies the disconnect between accrual profit and cash flow · Names a specific accrual item · Explains the directional effect on cash

Lesson 3

The accounting equation

You will be able to state Assets = Liabilities + Equity and explain why every transaction keeps it in balance. Covers the five account types and double-entry logic without journal entries. Prevents the belief that equity is a pile of cash.

15 min3 assessments

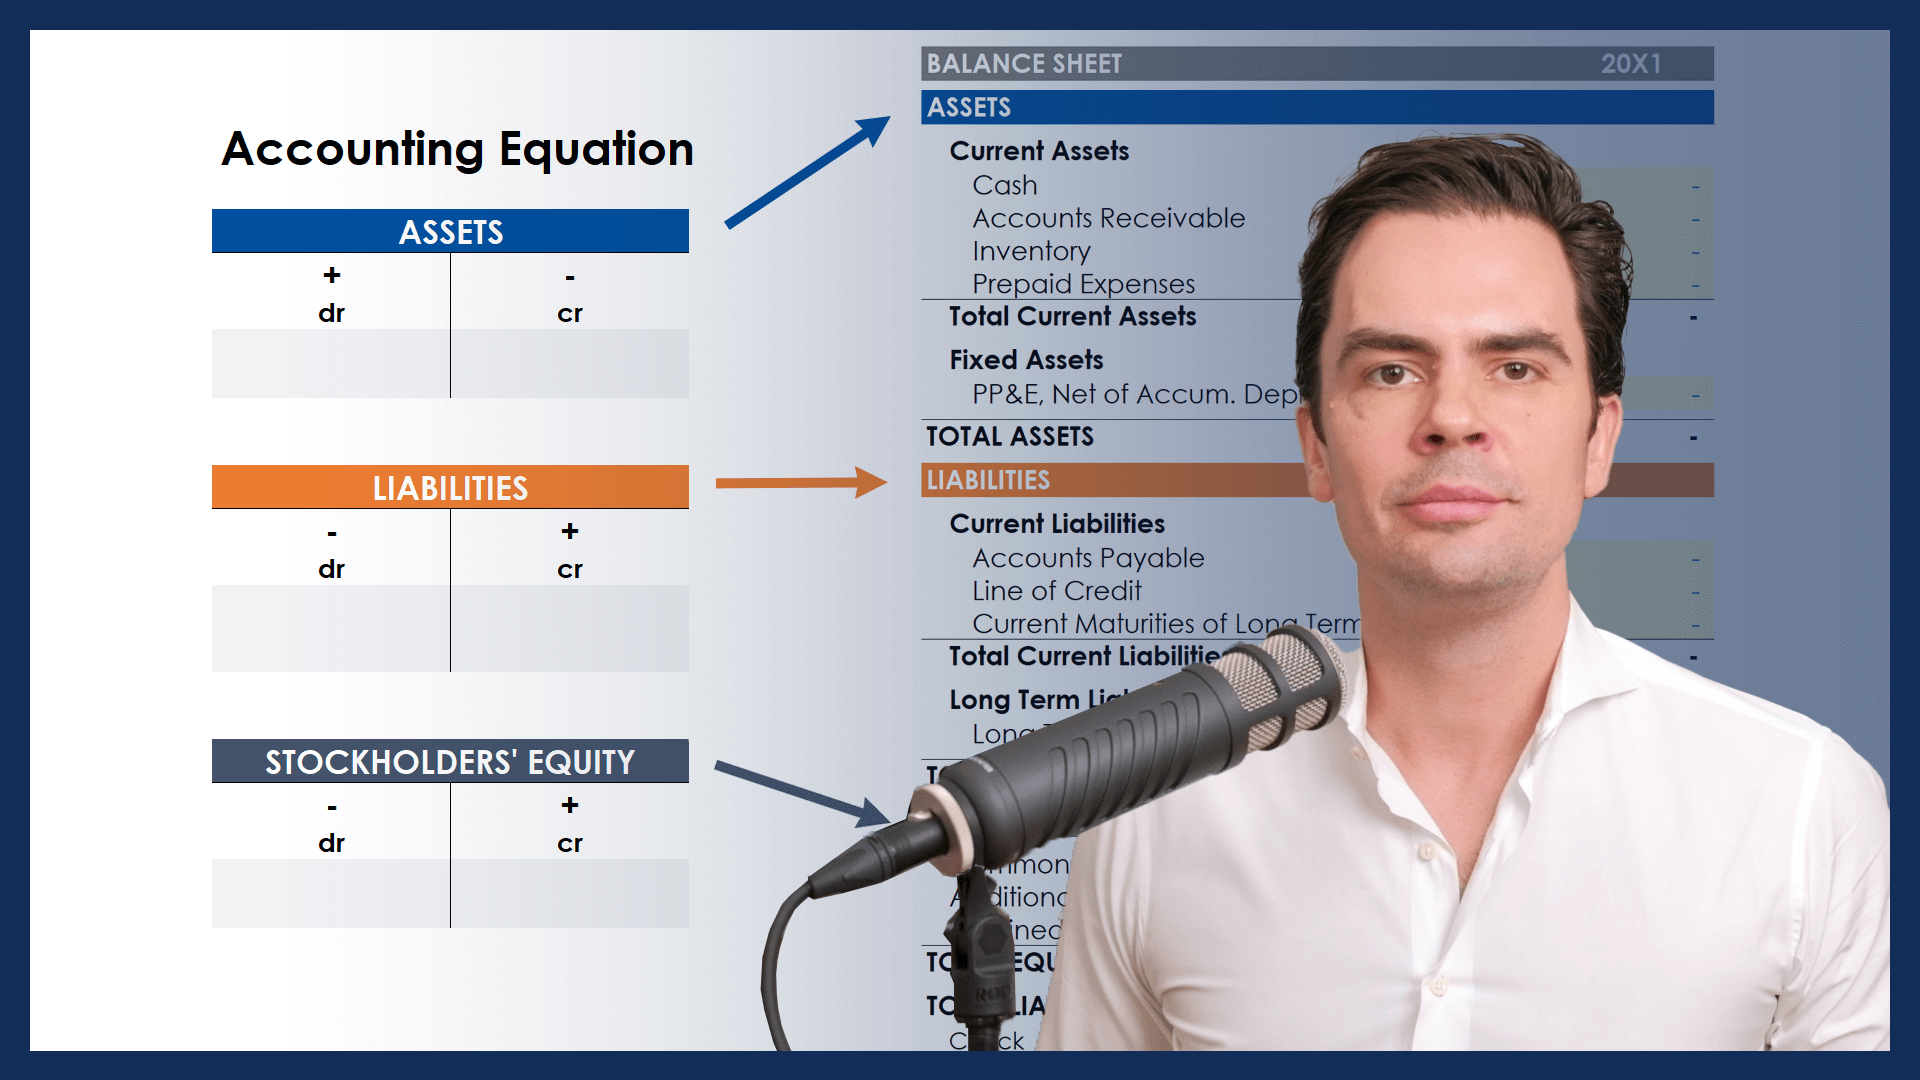
Open any annual report and you will see three numbers that never change the way they relate: Assets, Liabilities, and Equity. The accounting equation states that Assets = Liabilities + Equity. This is not a coincidence—it is the inescapable result of how every single transaction is recorded.

Think of the equation as a snapshot of what the company owns (assets) and who provided the money to buy those assets. Liabilities are claims by creditors; Equity is the owners' residual claim. Every transaction changes at least two accounts, always keeping the equation in balance. For example, if a company buys inventory with cash, one asset (inventory) increases and another asset (cash) decreases—the total stays the same. If it borrows money, both assets (cash) and liabilities (loan) increase by the same amount.

Equity is not a pile of cash. It consists of the owners' original investment plus retained earnings (profits kept in the business, minus any dividends). Profits increase equity through revenue, and losses decrease it through expenses. The equation forces you to see that a company's health depends on how it finances its assets, not just on how much cash it has.

The accounting equation stays balanced when a company borrows money: both assets and liabilities increase by the same amount.

Analogy

Imagine a seesaw with a pile of rocks on one side (Assets) and two buckets on the other side (Liabilities and Equity). The seesaw must always be level. When you add a rock to the assets side, you must add weight to either the liabilities bucket or the equity bucket to keep it balanced. When you remove a rock, you must remove weight from the other side.

In this analogy, the rocks are the company's resources, and the buckets represent the claims on those resources. The seesaw shows that the total value of assets always equals the total claims.

Where the analogy breaks down

The seesaw analogy suggests that equity is a fixed claim like a liability, but equity is actually a residual—it changes with profits and losses, not by direct addition or removal. Also, in a seesaw, adding weight to one side forces the other side to move, but in accounting, both sides can increase or decrease together without one going down as the other goes up.

Common misconception

“Equity is the amount of cash the company has in the bank.”

When you start a business, you invest cash, and that cash becomes part of equity. Many people see the owner's investment as cash, so they assume equity is always cash.

What is actually true

Equity is the residual interest in the company's assets after deducting liabilities. It includes the owner's original investment, but also retained earnings from profits (which may be tied up in inventory, equipment, or receivables—not cash). A company can have high equity but low cash if it has invested heavily in assets.

  • The accounting equation is Assets = Liabilities + Equity, and it must always balance after every transaction.
  • Every transaction affects at least two accounts, keeping the equation in balance.
  • Liabilities represent claims by creditors; Equity represents the owners' residual claim.
  • Equity consists of owner's capital, retained earnings (revenue – expenses – dividends), and other reserves.
  • A profit increases equity (through retained earnings), while a loss or dividend decreases equity.
  • The equation is the foundation of double-entry accounting and the balance sheet.
Check yourself

Check your understanding of the accounting equation.

1Multiple choiceChecked instantly

Which of the following best describes the accounting equation?

  • AAssets = Liabilities – Equity
  • BAssets = Liabilities + Equity
  • CLiabilities = Assets + Equity
  • DEquity = Assets + Liabilities
2Short answerMarked by AI

A company pays $5,000 cash to reduce a loan. Using the accounting equation, identify the accounts affected and explain why the equation remains balanced.

Graded on Identifies the accounts affected correctly · Explains why the equation remains balanced

3EssayMarked by AI

A friend says: 'A company that makes a profit of $100,000 will have $100,000 more in cash.' Using the accounting equation, explain why this statement is misleading. Include what actually happens to the components of equity when a profit is earned.

Graded on Correctly identifies profit's effect on equity (retained earnings) · Distinguishes between profit and cash flow · Explains the role of accrual accounting in the equation

Lesson 4

The three statements at a glance

Names the income statement, balance sheet, and cash flow statement, and gives a one-sentence answer for the question each one addresses.

10 min3 assessments

You learned in "What the three statements are and why they exist" that every public company publishes three core financial statements. Now you need to be able to open any annual report and immediately say which statement answers which question. Here's the cheat sheet:

  • Income statement answers: Did the company make a profit? It shows revenue, expenses, and net income over a period (a quarter or year).
  • Balance sheet answers: What does the company own and owe right now? It lists assets, liabilities, and equity at a single point in time.
  • Cash flow statement answers: Where did cash come from and where did it go? It tracks actual cash inflows and outflows from operations, investing, and financing.
Reference

The Three Financial Statements at a Glance

Income statement

Question It Answers
Did the company make a profit?
Key Equation
Revenue – Expenses = Net Income
Time Perspective
Period (e.g. year, quarter)

Balance sheet

Question It Answers
What does the company own and owe?
Key Equation
Assets = Liabilities + Equity
Time Perspective
Point in time (e.g. Dec 31)

Cash flow statement

Question It Answers
Where did cash come from and go?
Key Equation
Operating + Investing + Financing = Net Change in Cash
Time Perspective
Period (e.g. year, quarter)

All three statements together tell the full financial story. The income statement shows profitability, the balance sheet shows financial strength, and the cash flow statement shows liquidity.

Practice
0/12 known
1 / 12
Check yourself

Check your understanding of the three statements.

1Multiple choiceChecked instantly

If you want to know whether a company generated enough cash from its day-to-day operations to pay its suppliers, which statement would you consult?

  • AIncome statement
  • BBalance sheet
  • CCash flow statement
  • DStatement of retained earnings
2Select all that applyChecked instantly

Which of the following are true about the balance sheet? (Select two.)

  • AIt covers a period of time.
  • BIt shows assets, liabilities, and equity.
  • CIt follows the equation Assets = Liabilities + Equity.
  • DIt shows revenue and expenses.
3Fill the blanksChecked instantly

Lesson 5

Reporting period and fiscal year

Explains that financial statements cover a specific period (quarter or year) and why the fiscal year may differ from the calendar year.

10 min4 assessments

Open an annual report and the first thing you hit is a date line: For the year ended January 31, 2025 or As of December 31, 2024. You already know the three statements answer different questions — now look at the dates stamped on them, because those dates do two different jobs.

Every set of statements is tied to a reporting period — the span of time it covers. The income statement and cash flow statement cover a stretch of time, so they read for the year ended… or for the three months ended…. The balance sheet is a photograph taken at one instant, so it reads as of…: the position at the close of business on that date, nothing more.

The fiscal year is the 12-month period a company chooses for its accounting. Many companies use the calendar year, but plenty do not. Retailers often end their fiscal year in late January, so the holiday season lands inside one reporting year and the books close after inventory is cleared. Apple ends its fiscal year in late September, timed to its product cycle. The rule is that the year-end must be consistent and disclosed.

Here is the trap. A fiscal year is named after the calendar year in which it ends. A retailer whose year ends January 31, 2025 calls that period fiscal 2025 even though almost all of it fell in 2024. Its Q1 runs February through April — not January through March. When you compare two companies, compare periods that actually line up, not labels that sound alike.

  • The income statement and cash flow statement cover a period of time; the balance sheet is a snapshot at one date.
  • A fiscal year is any 12-month accounting period and need not match the calendar year.
  • A fiscal year is named for the calendar year in which it ends: a year ending January 31, 2025 is FY2025.
  • A company's Q1 is the first three months of its fiscal year — February through April, if the year ends in January.
  • Retailers often close their fiscal year in January so the holiday season sits inside one reporting year.
  • Before comparing two companies' annual numbers, check that the periods actually overlap.
Reference

Reading the date line on a financial statement

For the year ended December 31, 2024

What it means
Covers the 12 months from January 1 to December 31, 2024
Appears on
Income statement, cash flow statement

For the three months ended March 31, 2024

What it means
Covers the first quarter: January through March 2024
Appears on
Income statement, cash flow statement in a quarterly report

As of December 31, 2024

What it means
A snapshot at the close of business on that date
Appears on
Balance sheet

For the fiscal year ended January 31, 2025

What it means
Covers February 1, 2024 through January 31, 2025; reported as FY2025
Appears on
Income statement, cash flow statement

For the 52 weeks ended February 1, 2025

What it means
A 52-week year so every year has the same number of weeks; an extra week is added roughly every five to six years
Appears on
Income statement, cash flow statement of many retailers

Read the date line before comparing anything — two annual figures can cover different months.

Practice
0/10 known
1 / 10
Go deeper

Reach for these when a report's period looks unusual — a 52/53-week year, a changed year-end, or a stub period.

Check yourself

Four checks on the dates and periods you just met.

1Multiple choiceChecked instantly

A balance sheet dated 'As of December 31, 2024' shows:

  • AThe company's financial position at the close of business on December 31, 2024
  • BThe company's revenue and expenses for the whole of 2024
  • CThe cash that flowed in and out during December 2024
  • DThe company's expected financial position at the end of 2025
2Select all that applyChecked instantly

A retailer's fiscal year ends January 31, 2025. More than one of the following is true. Select every true statement.

  • AFY2025 covers February 1, 2024 through January 31, 2025
  • BQ1 of FY2025 runs from February through April 2024
  • CFY2025 is identical to calendar year 2025
  • DThe November–December 2024 holiday season falls inside FY2025
  • EQ4 of FY2025 runs from October through December 2024
3Fill the blanksChecked instantly
4Short answerMarked by AI

Company A reports annual revenue for the year ended December 31, 2024. Company B reports annual revenue for the fiscal year ended June 30, 2024. You want to compare their 2024 performance. What is the problem with a direct comparison, and what should you check before concluding anything?

Graded on Names the period mismatch precisely · Gives a concrete fix for comparing · States why the mismatch matters

Lesson 6

Who reads each statement

Describes the primary stakeholders (investors, lenders, managers, regulators) and the statement they focus on most.

10 min3 assessments

You already know the three financial statements: the income statement, balance sheet, and cash flow statement. Each one answers a different question about a company's health. But who actually reads them? Different stakeholders—investors, lenders, managers, and regulators—each have a primary focus.

  • Investors care most about profitability and growth, so they start with the income statement.
  • Lenders want to know if the company can repay its debts, so they turn to the balance sheet.
  • Managers need to ensure the business has enough cash to operate day-to-day, so they watch the cash flow statement closely.
  • Regulators check for compliance with accounting rules, so they review all three but particularly the notes and disclosures.

In this lesson, you'll practice explaining these connections out loud—just as you would in a real business conversation.

  • Investors primarily read the income statement to assess profitability and earnings per share.
  • Lenders focus on the balance sheet to evaluate solvency and debt levels.
  • Managers monitor the cash flow statement to ensure liquidity and operational cash needs.
  • Regulators review all statements but pay special attention to notes and disclosures for compliance.
  • Each stakeholder group uses the statements to answer a specific question: 'Is this company profitable?', 'Can it pay its debts?', 'Does it have enough cash?', 'Is it following the rules?'
Say it

Listen to each sentence, then say it twice. Focus on clear pronunciation and the correct emphasis on key words.

Investors look at the income statement.

Investors look at the income statement.

/in-VEST-ers look at the IN-come state-ment/

Lenders focus on the balance sheet.

Lenders focus on the balance sheet.

/LEND-ers FO-cus on the BAL-ance sheet/

Managers watch the cash flow statement.

Managers watch the cash flow statement.

/MAN-a-jers watch the CASH flow state-ment/

Regulators check all three statements.

Regulators check all three statements.

/REG-u-la-tors check all three state-ments/

Role-play

You are a financial analyst. A colleague from another department needs help choosing the right financial statement to answer three different questions. Respond with the correct statement each time.

You are the analyst; you're talking to the colleague.

Goal: Guide the colleague to the correct financial statement for each of three questions: debt repayment, profitability, and cash availability.

Check yourself

Test your understanding of who reads each statement.

1Multiple choiceChecked instantly

A bank considering a loan would look most closely at which financial statement?

  • AIncome statement
  • BBalance sheet
  • CCash flow statement
  • DStatement of retained earnings
2Fill the blanksChecked instantly
3Short answerMarked by AI

Explain why a company's managers pay close attention to the cash flow statement even when the income statement shows a profit.

Graded on Identifies the difference between accrual profit and cash flow · Provides a concrete example of a cash flow problem despite profit

Lesson 7

Reading the income statement top to bottom

You will be able to trace revenue down to net income and name what each line subtracts. Covers revenue, COGS, gross profit, operating expenses, EBIT, interest, tax and net income, plus the difference between operating and non-operating items. Prevents confusing gross margin with net margin.

35 min3 assessments

You open an annual report and see a table that starts with Revenue at the top and ends with Net income at the bottom. Between them, something subtracts every cost of running the business. If you can't read that sequence, you can't tell whether a company is making money from its actual operations or just from a one-time tax benefit. The income statement is a waterfall: each line removes a specific category of cost, and you need to know which pool each cost belongs to.

This lesson gives you a mental map of that waterfall. Once you know the layers, you can look at any income statement and immediately see where the money is being earned and where it is leaking.

The income statement waterfall: each line subtracts a specific cost category, revealing a new profit metric.

Steps
0/5

We'll walk through the income statement of a real company, Acme Corp, for the year ended December 31, 2024. All numbers are in thousands of dollars. You'll trace each line down to net income.

  1. Start with Revenue

    Acme reports Revenue of $1,000,000. This is the total value of goods sold during the year. No deductions yet.

    Make sure you are looking at the total revenue line, not net revenue after returns (which some companies show separately).

    You should see a single number at the top of the income statement labeled 'Revenue' or 'Sales'.

  2. Subtract Cost of Goods Sold (COGS)

    COGS is $400,000. This includes the direct costs of making the product: raw materials, direct labor, factory overhead. Subtract: $1,000,000 - $400,000 = $600,000 Gross Profit.

    COGS does not include selling, general, or administrative expenses. Those come later.

    Gross Profit should be $600,000. Verify the calculation matches the statement.

  3. Subtract Operating Expenses

    Operating Expenses total $300,000. These are SG&A (selling, general & administrative), R&D, and depreciation. Subtract: $600,000 - $300,000 = $300,000 EBIT (Earnings Before Interest and Taxes).

    Operating expenses do not include interest or taxes. That's why EBIT is called 'operating income'.

    EBIT line should be $300,000. Look for 'Operating Income' or 'EBIT'.

  4. Subtract Interest Expense

    Interest Expense is $20,000. This is the cost of debt (bank loans, bonds). Subtract: $300,000 - $20,000 = $280,000 Pre-Tax Income.

    Interest is a financing cost, not an operating cost. It comes after EBIT.

    Pre-Tax Income should be $280,000, labeled 'Income Before Tax' or 'Pre-Tax Income'.

  5. Subtract Income Tax

    Income Tax is $80,000. This is the estimated tax expense for the year. Subtract: $280,000 - $80,000 = $200,000 Net Income.

    Tax expense is based on pre-tax income, not on cash paid. It is an accrual.

    Net Income should be $200,000, the bottom line.

  • Revenue is the top line; net income is the bottom line; every line in between subtracts a specific cost category.
  • COGS captures only direct production costs; operating expenses cover everything else needed to run the business.
  • Gross profit = Revenue - COGS; it shows the markup on goods before overhead.
  • EBIT (operating income) = Gross profit - Operating expenses; it measures profit from core business operations.
  • Interest and taxes are non-operating items, subtracted after EBIT to get net income.
  • Gross margin (Gross profit / Revenue) and net margin (Net income / Revenue) answer different questions; never confuse them.
Common misconception

“Operating expenses include interest and taxes because those are also costs of running a business.”

Both interest and taxes are real cash outflows that reduce profit, so it feels natural to lump them together with other expenses like salaries or rent.

What is actually true

Interest is a financing cost (how you fund the business, not how you run it), and tax is a government levy. Operating expenses are only the costs directly tied to producing and selling goods or services. Mixing them hides how well the core business is performing. EBIT exists precisely to separate operating performance from financing and tax effects.

Check yourself

Check your understanding of the income statement structure.

1Multiple choiceChecked instantly

Which of the following is the correct order of items on a multi-step income statement, from top to bottom?

  • ARevenue, Gross Profit, COGS, Operating Expenses, EBIT, Interest, Tax, Net Income
  • BRevenue, COGS, Gross Profit, Operating Expenses, EBIT, Interest, Tax, Net Income
  • CRevenue, Operating Expenses, Gross Profit, COGS, EBIT, Interest, Tax, Net Income
  • DRevenue, COGS, Gross Profit, Interest, EBIT, Operating Expenses, Tax, Net Income
2Fill the blanksChecked instantly
3Short answerMarked by AI

A company has Revenue of $500,000, COGS of $200,000, Operating Expenses of $150,000, Interest Expense of $10,000, and Tax Expense of $30,000. Calculate Gross Profit, EBIT, and Net Income. Show your work.

Graded on Correctly calculates Gross Profit · Correctly calculates EBIT · Correctly calculates Net Income

Lesson 8

Revenue recognition pitfalls

You will be able to spot when a company is booking revenue too early or for transactions that are not genuine sales. Covers bill-and-hold, channel stuffing and the five-step IFRS 15 model in plain language. Prevents taking the top line at face value.

25 min3 assessments

You spot a company that looks like a rocket ship: revenue up 25%, earnings up 30%. Then you check the cash flow statement and see cash from customers barely moved. Why? The cash never arrived—the revenue was booked but not collected. That gap is the most common clue that a company is recognizing revenue too early or on fake transactions.

Revenue recognition under IFRS 15 follows a five-step model: (1) identify the contract, (2) identify performance obligations, (3) determine the transaction price, (4) allocate the price, (5) recognize revenue when control transfers. Two common pitfalls within this model are bill-and-hold arrangements (where revenue is booked before delivery) and channel stuffing (shipping excess inventory to distributors near quarter-end). Both inflate the top line without genuine cash flow.

Common misconception

“Revenue is the cash a company receives from customers.”

Cash is tangible; most people equate sales with money changing hands. In everyday transactions, revenue and cash arrive together.

What is actually true

Under accrual accounting, revenue is recognized when control of goods or services transfers to the customer—not when cash arrives. This means revenue can be booked long before cash is collected (e.g., on credit sales) or even when cash is never collected (e.g., if a customer defaults). A company can look profitable on the income statement while burning cash, as the divergence between net income and operating cash flow reveals.

Decision tree for spotting revenue recognition problems.

Decide

You are analyzing TechDynamix's annual report. Revenue grew 25% to $100M. Accounts receivable grew from $20M to $40M. Cash from operations is $80M. The company's revenue recognition policy states: 'Revenue is recognized upon transfer of control of the product to the customer, which occurs upon shipment for most transactions, and upon customer acceptance for certain large orders.' You also notice that sales in the last week of the quarter are 40% of total quarterly sales.

What does the divergence between revenue growth and cash collection suggest?

  • Revenue recognized before cash is received creates a gap between net income and operating cash flow.
  • A rapid increase in accounts receivable relative to sales is a red flag for premature revenue recognition.
  • Bill-and-hold arrangements require a substantive reason, specific identification of goods, and readiness for transfer.
  • Channel stuffing occurs when companies ship more inventory than customers can sell, often near quarter-end.
  • Always read the revenue recognition policy in the financial statement footnotes.
  • Compare cash from operations to revenue growth to detect potential manipulation.
Check yourself

Test your ability to spot revenue recognition pitfalls.

1Select all that applyChecked instantly

Which of the following are red flags for potential revenue recognition manipulation? (Select two.)

  • ARevenue growth consistently outpacing cash from operations
  • BGross margin stable year over year
  • CAccounts receivable as a percentage of sales has increased sharply
  • DThe company has a high proportion of service revenue
2Put in orderChecked instantly

Put the five steps of the IFRS 15 revenue recognition model in the correct order.

  • AAllocate transaction price to performance obligations
  • BDetermine the transaction price
  • CIdentify the contract with a customer
  • DRecognize revenue when (or as) the entity satisfies a performance obligation
  • EIdentify the performance obligations in the contract
3Multiple choiceChecked instantly

TechDynamix reported revenue growth of 25% but cash from operations grew only 10%. Accounts receivable increased 50%. Sales in the last week of the quarter were 40% of total quarterly sales. Which revenue manipulation pitfall is most likely present?

  • ABill-and-hold arrangement
  • BChannel stuffing
  • CLayaway sales
  • DDeferred revenue

Lesson 9

Revenue to gross profit

Walks through the top section of the income statement: revenue, cost of goods sold, and gross profit calculation.

15 min3 assessments

BlueSky Tech: Revenue to Gross Profit

Revenue (Sales): $10,000,000

Cost of Goods Sold (COGS): $4,000,000

Gross Profit = Revenue – COGS = $10,000,000 – $4,000,000 = $6,000,000

Gross Margin = Gross Profit ÷ Revenue = $6,000,000 ÷ $10,000,000 = 60%

A 60% gross margin means for every dollar of revenue, 40 cents go to direct production costs and 60 cents remain to cover operating expenses and profit. Both the dollar amount ($6M) and the percentage (60%) are used to assess the business's core profitability.

Steps
0/5

You have the income statement for BlueSky Tech in front of you. Your task is to calculate gross profit and gross margin just as an analyst would. Follow each step in order.

  1. Find the Revenue line

    Locate the line labelled 'Revenue' or 'Sales' – it is always the first line on the income statement. On BlueSky's statement it reads $10,000,000.

    Some companies report 'Net Revenue' after discounts and returns. Use that, not the gross sales figure.

    You have a single dollar figure for total revenue.

  2. Find the Cost of Goods Sold line

    Directly below revenue you will find 'Cost of Goods Sold' or 'Cost of Sales'. It lists the direct costs of producing what the company sells – materials, direct labour, manufacturing overhead. For BlueSky it is $4,000,000.

    Do not confuse COGS with operating expenses (e.g., sales commissions, rent for headquarters). Those come later.

    You have a COGS figure that includes only production-related expenses.

  3. Subtract COGS from Revenue

    Gross Profit = Revenue – COGS. Using the numbers: $10,000,000 – $4,000,000 = $6,000,000. Write down this number.

    A negative gross profit means the company is selling products below production cost – a red flag unless a deliberate strategy.

    Your gross profit is positive and equals the difference between the two figures you found.

  4. Calculate Gross Margin

    Gross Margin = Gross Profit ÷ Revenue. Multiply by 100 to get a percentage: ($6,000,000 ÷ $10,000,000) × 100 = 60%. This percentage tells you how much of each sales dollar is left after direct costs.

    Always use the same revenue figure you started with – never net income or operating profit.

    Your gross margin is between 0% and 100% (unless something is very wrong).

  5. Interpret the result

    Compare to industry averages. A 60% gross margin could be strong for a hardware firm but average for a software company. The key question: does this margin give the company enough cushion to cover its operating expenses and still turn a profit?

    Gross margin alone does not tell you about overall profitability – you still need to subtract operating expenses, interest and taxes.

    You can state whether the gross margin is high, low, or average relative to the industry.

Checklist
0/7

Income Statement Check: Revenue to Gross Profit

Keep this checklist open while you review any income statement. Tick each item before moving on.

  • Revenue is the total money from selling goods or services, listed first on the income statement.
  • Cost of Goods Sold (COGS) includes direct materials, direct labour, and manufacturing overhead – not sales or admin costs.
  • Gross Profit = Revenue – COGS; it represents the profit after covering direct production costs.
  • Gross Margin = Gross Profit / Revenue × 100%; it allows comparison across companies of different sizes.
  • A high gross margin indicates strong pricing power and/or efficient production.
  • Gross profit is not the final profit – operating expenses, interest and taxes still need to be subtracted.
  • Always verify that the COGS figure excludes depreciation write-offs and other non-cash items unless they are part of production overhead.
Go deeper

Refer to these when you need to cross-check definitions or explore gross margin vs. profit margin in more depth.

Check yourself

Check your understanding of revenue, COGS and gross profit.

1Put in orderChecked instantly

Arrange the steps to calculate gross margin in the correct order.

  • AFind the revenue figure
  • BCalculate gross profit as revenue minus COGS
  • CFind the cost of goods sold (COGS) figure
  • DDivide gross profit by revenue and multiply by 100 to get the percentage

Graded on Correct order of steps for gross margin calculation · All steps included

2Short answerMarked by AI

You are analysing two companies in the same industry. Company A reports gross profit of $8 million and revenue of $20 million. Company B reports gross profit of $12 million and revenue of $50 million. Which company has better pricing power or production efficiency? Use the gross margin to support your answer (2-4 sentences).

Graded on Calculates and reports both gross margins correctly · Uses gross margin to compare pricing power / efficiency · Justifies why gross margin is a better measure than absolute gross profit

3Short answerMarked by AI

A startup reports revenue of $2,000,000 and COGS of $1,600,000. Calculate its gross profit and gross margin. In one sentence, state a likely reason the margin is low (2-4 sentences total).

Graded on Correctly calculates gross profit · Correctly calculates gross margin percentage · Suggests a plausible reason for low margin

Lesson 10

Operating expenses and EBIT

Covers selling, general and administrative expenses, research and development, and how they lead to earnings before interest and taxes (EBIT).

15 min3 assessments

You've already traced revenue down to gross profit. Now you're looking at the next section of the income statement: operating expenses. These are the costs of running the business that aren't directly tied to making the product — things like sales team salaries, office rent, marketing, and research. After subtracting operating expenses from gross profit, you get EBIT (Earnings Before Interest and Taxes), also called operating income. EBIT shows how profitable the core business is, before financing costs and taxes. It's a key measure because it isolates the operating performance from how the company is funded.

  • Operating expenses include Selling, General & Administrative (SG&A) and Research & Development (R&D).
  • EBIT = Gross Profit – Total Operating Expenses.
  • EBIT is also called operating income or operating profit.
  • EBIT excludes interest income/expense and taxes.
  • Operating margin = EBIT ÷ Revenue, showing profitability of operations.
Steps
0/6

Follow these steps to find operating expenses and EBIT on any income statement. Have a real statement open (or the example below).

  1. Locate the operating expenses section

    Find the area after gross profit. Look for a line labeled 'Operating Expenses', 'Selling, General and Administrative', or 'SG&A'. Often it's a subsection with multiple lines and a subtotal.

    Some companies lump all operating expenses into one line; others break them out. Look for the subtotal.

    You see a subtotal called 'Total Operating Expenses' or a number that sums the lines below.

  2. Identify SG&A and R&D separately (if broken out)

    Scan for 'Selling, General and Administrative' and 'Research and Development'. These are the two most common categories. Note their values.

    Not all companies have R&D; some include it in SG&A. If only one line, that's fine.

    You can name at least one category of operating expense.

  3. Find the total operating expenses

    Look for a line that sums them, often 'Total Operating Expenses' or just the number right before EBIT. If there's no total, add the lines yourself.

    If you add lines, double-check that you haven't missed any (like amortization or restructuring).

    Total operating expenses is a single number.

  4. Find EBIT

    Look for 'Operating Income', 'Operating Profit', 'EBIT', or 'Earnings Before Interest and Taxes'. It's the line right after total operating expenses.

    Some statements call it 'Income from Operations'. If you see 'Net Income' before interest, you've gone too far.

    You see a line labeled with one of those names.

  5. Verify EBIT by subtracting operating expenses from gross profit

    Take gross profit (from earlier in the statement) and subtract total operating expenses. The result should equal EBIT. If not, check for other operating items like restructuring charges.

    Non-recurring items may be included; read the footnotes. Small rounding differences are okay.

    EBIT equals gross profit minus total operating expenses (within rounding).

  6. Calculate operating margin

    Divide EBIT by revenue. Multiply by 100 to get a percentage. Compare to industry averages (e.g., 10–20% for many industries).

    Don't confuse with net profit margin (which includes interest and tax). Operating margin focuses on core operations.

    You have a percentage you can use to benchmark.

Checklist
0/6

Reading Operating Expenses & EBIT – Field Checklist

Tick each item as you confirm it on the actual statement. If any item can't be ticked, you may be looking at a different section.

Acme Corp – Simplified Income Statement

LineAmount
Revenue$10,000,000
Cost of Goods Sold$4,000,000
Gross Profit$6,000,000
Selling, General & Administrative$2,000,000
Research & Development$1,000,000
Total Operating Expenses$3,000,000
EBIT (Operating Income)$3,000,000
Interest Expense$500,000
Tax Expense$750,000
Net Income$1,750,000

EBIT = Gross Profit ($6M) – Total Operating Expenses ($3M) = $3M. Operating margin = $3M / $10M = 30%. This means for every dollar of revenue, 30 cents remains after covering operating costs but before interest and taxes. Notice EBIT is higher than net income because interest and tax haven't been subtracted yet.

Check yourself

Check your understanding of operating expenses and EBIT.

1Put in orderChecked instantly

Put the following steps in the correct order for reading an income statement to find EBIT.

  • ALocate total operating expenses
  • BFind EBIT (operating income)
  • CIdentify gross profit
  • DCalculate operating margin
  • EIdentify revenue at the top
2Short answerMarked by AI

A company reports: Revenue $2,000,000, COGS $800,000, SG&A $400,000, R&D $150,000, Interest $50,000, Tax $100,000. What is EBIT? In one sentence, explain what EBIT tells you about this company's operations.

Graded on Correct EBIT calculation · Interpretation of EBIT

3Multiple choiceChecked instantly

Which of the following is typically included in Selling, General & Administrative (SG&A) expenses?

  • ACost of raw materials used in production
  • BSales commissions paid to the sales team
  • CDepreciation of factory machinery
  • DSalaries of research scientists

Lesson 11

Below the line: interest, tax, net income

Explains the items after EBIT: interest expense, income tax, and the final net income figure.

10 min3 assessments

You've traced revenue down to EBIT (earnings before interest and tax). Now you cross the below‑the‑line items — interest expense and income tax — that transform operating profit into the number that actually belongs to shareholders: net income. These two deductions are not optional; every company that borrows money or pays taxes faces them. The order matters: interest is subtracted first, then tax is calculated on the result.

From EBIT to net income

A company reports:

  • EBIT: $1,200,000
  • Interest expense: $150,000
  • Income tax rate: 25%

Step 1 – Subtract interest $1,200,000 – $150,000 = $1,050,000 (earnings before tax, or EBT)

Step 2 – Calculate tax $1,050,000 × 25% = $262,500

Step 3 – Subtract tax $1,050,000 – $262,500 = $787,500 (net income)

If the company had no debt, interest would be $0 and net income would be $900,000. The $150,000 interest cost reduced net income by $112,500 after tax ($150,000 × (1 – 25%)).

Steps
0/4

Follow these steps each time you read a real income statement. Have the company's EBIT, interest expense, and tax rate ready.

  1. Locate EBIT

    Find the EBIT (or operating profit) line. It is the last line before interest and tax are separated. In many statements it is labelled 'Income from operations' or 'Operating profit'.

    Some statements include 'other income/expense' above EBIT. Make sure you are using the figure that truly represents operating profit, not the net of all non‑operating items.

    The number you have matches the line that appears just before 'Interest expense' or 'Finance costs'.

  2. Subtract interest expense

    Find the line labelled 'Interest expense' (or 'Finance costs'). Subtract it from EBIT. The result is earnings before tax (EBT).

    Interest income (if any) is sometimes netted against interest expense. If they are separate, only subtract the expense, not the net.

    EBT = EBIT – Interest expense. Confirm by looking at the 'Income before tax' line if the statement provides it.

  3. Identify the tax rate

    Look for 'Income tax expense' and the 'Effective tax rate' (often disclosed in a footnote). The rate is the percentage of EBT paid as tax.

    The effective tax rate in the footnotes may differ from the statutory rate. Use the effective rate from the statements, not your own guess.

    You have a tax amount (absolute) and a rate. Multiply EBT by the rate to verify the tax amount matches the line item.

  4. Compute net income

    Subtract the income tax expense from EBT: Net income = EBT – Income tax expense. This is the final bottom line, the profit attributable to shareholders.

    If net income is negative, the company made a loss. In that case, the tax line may be negative (a tax benefit) or zero.

    Net income is the last number on the income statement. It should match the 'Net earnings' or 'Profit for the period' line.

Checklist
0/5

Verifying the below‑the‑line section

Use this checklist every time you open an income statement. Tick each item before moving on.

Go deeper

For a deeper dive into how income tax is calculated in the United States, including deferred taxes and effective rates, refer to this article.

Check yourself

Check your understanding of the below‑the‑line items.

1Put in orderChecked instantly

Arrange the following steps in the correct order to compute net income from EBIT.

  • ASubtract interest expense from EBIT to get EBT
  • BMultiply EBT by the tax rate to get income tax expense
  • CSubtract income tax expense from EBT to get net income
  • DIdentify the effective tax rate from the footnotes
2Short answerMarked by AI

A company has EBIT of $2,000,000, interest expense of $300,000, and an effective tax rate of 20%. What is its net income? Show your working.

Graded on Calculates EBT correctly · Computes income tax correctly · States final net income

3Multiple choiceChecked instantly

Why is interest expense subtracted before income tax on the income statement?

  • ABecause interest payments are made before tax is calculated.
  • BBecause interest is a tax‑deductible expense, so the tax base is earnings after interest.
  • CBecause interest is part of operating expenses.
  • DBecause tax authorities require interest to be reported separately.

Lesson 12

Operating vs non-operating items

Distinguishes between income and expenses from core business operations and those from peripheral activities like investments or asset sales.

10 min3 assessments

You already know that net income is the bottom line, but not all of it comes from making or selling products. A company might earn interest on cash it sits on, sell a factory for a gain, or pay a fine for a lawsuit – these are all real, but they aren’t the core business. The distinction between operating and non-operating items is what allows you to see whether profit is driven by the company’s actual operations or by one‑time events, investment returns, or financing decisions.

Operating items come from the company’s main business activities: selling goods or services, paying employees, buying inventory. They are expected to continue year after year. Non‑operating items are everything else – interest income, gains or losses on asset sales, foreign‑exchange adjustments, restructuring charges. They are unpredictable and often non‑recurring.

To judge a company’s health, you almost always look at operating income (EBIT) first. Net income can be inflated by a lucky asset sale or depressed by a one‑time writedown, but operating income tells you whether the core business is earning money.

The following table shows the key differences between operating and non‑operating items. Use it whenever you need to classify a line item on an income statement.

Operating items

Definition
Directly part of producing and selling the main product or service
Recurrence
Recurring every period (revenue, COGS, salaries)
Predictability
Relatively predictable based on historical trends
Core to business
Yes – they define the reason the company exists
Typical examples
Sales revenue, cost of goods sold, selling and administrative expenses

Best for Assessing the sustainable earning power of the core business

Non‑operating items

Definition
Arises from peripheral activities (investing, financing, one‑time events)
Recurrence
Irregular or one‑time (asset sales, legal settlements)
Predictability
Unpredictable in timing and amount
Core to business
No – they are incidental to the main mission
Typical examples
Gain on sale of equipment, interest income/expense, foreign exchange gains/losses

Best for Evaluating management’s capital allocation decisions or one‑off impacts

ABC Manufacturing – simplified income statement

ABC Manufacturing reports the following figures for the year (in thousands):

ItemAmount
Revenue$1,000
Cost of goods sold($600)
Gross profit$400
Selling, general & admin expenses($200)
Operating profit (EBIT)$200
Gain on sale of factory building$50
Interest income$10
Interest expense($20)
Profit before tax$240
Income tax($50)
Net income$190

Identify the non‑operating items.

  • Gain on sale of factory building ($50) – one‑time, from selling a fixed asset, not from manufacturing.
  • Interest income ($10) – from cash investments, not from core operations.
  • Interest expense ($20) – debt financing cost, not an operating expense.

Operating profit ($200) is already free of these items. If you want a conservative view of sustainable earnings, you would start with operating profit and ignore the non‑operating gains and expenses. Net income ($190) looks lower partly because of interest expense, but the core business generated $200k. A year with a large asset sale would inflate net income; a year without it would show the true operating trend.

Check yourself

Test your ability to separate operating from non‑operating items.

1Multiple choiceChecked instantly

Which of the following is LEAST likely to be classified as an operating item on the income statement of a manufacturing company?

  • ARevenue from product sales
  • BCost of goods sold
  • CGain on sale of a factory building
  • DSalaries of production staff
2Select all that applyChecked instantly

A company's income statement shows: Sales Revenue $500k, COGS $300k, SG&A $100k, Interest Income $5k, Loss on Disposal of Old Equipment $20k, Net Income $125k. Which items are operating expenses? Select all that apply.

  • ASales Revenue
  • BCost of goods sold (COGS)
  • CSelling, general & administrative expenses (SG&A)
  • DInterest Income
  • ELoss on Disposal of Old Equipment
  • FNet Income
3Short answerMarked by AI

Explain why deducting non‑operating gains and losses from net income provides a clearer picture of a company's core profitability. Use the example of a manufacturing firm that reports a large one‑time gain from selling a warehouse in its net income.

Graded on Identifies the impact of one‑time non‑operating items on net income · Explains why removing non‑operating items yields a clearer picture of core profitability

  • Operating items arise from core business activities and are typically recurring.
  • Non‑operating items include gains/losses from asset sales, investment income, and one‑time charges.
  • EBIT (operating profit) excludes non‑operating items and reflects operating performance.
  • Analysts often calculate adjusted operating income by removing non‑operating items to assess sustainable earnings.
  • Separating the two helps determine whether profit growth is from real operations or financial/one‑time events.

Lesson 13

Reading the balance sheet

You will be able to walk the balance sheet and say what the company owns and owes. Covers current versus non-current assets and liabilities, working capital, and shareholders' equity. Prevents the error of looking at total assets without asking how they are funded.

35 min3 assessments

A balance sheet is a snapshot — it shows what a company owns and owes at a single moment, unlike the income statement you've already read, which covers a whole period. The picture it paints hangs on one rule: Assets = Liabilities + Equity. Everything on the left side of the balance sheet is something the company controls; everything on the right is how it was paid for — either borrowed (liabilities) or invested by owners (equity).

Walk through a real balance sheet and you'll learn to spot a company's financial health at a glance.

Standard balance sheet structure: assets on the left, liabilities and equity on the right. The equation must always balance.

Steps
0/10

Let's walk through the balance sheet of a fictional company, QuickBooks Inc., as of December 31, 2023. You'll see each section and verify the equation.

  1. Find the date and statement type

    Look at the top of the balance sheet. It says 'As of December 31, 2023'. This is a snapshot, not a period.

    You should see a single date, not a range like 'For the year ended'.

  2. List current assets

    Current assets are expected to be used within one year. QuickBooks has: Cash $50,000, Accounts Receivable $30,000, Inventory $20,000. Sum = $100,000.

    Total current assets = $100,000.

  3. List non-current assets

    Non-current assets are long-term. Property, Plant & Equipment $200,000, Intangible Assets $50,000. Sum = $250,000.

    Total non-current assets = $250,000.

  4. Add up total assets

    Current assets ($100,000) + Non-current assets ($250,000) = $350,000.

    Total assets = $350,000.

  5. List current liabilities

    Current liabilities are due within one year. Accounts Payable $25,000, Short-term Debt $15,000. Sum = $40,000.

    Total current liabilities = $40,000.

  6. List non-current liabilities

    Long-term Debt $100,000. Sum = $100,000.

    Total non-current liabilities = $100,000.

  7. Add up total liabilities

    Current liabilities ($40,000) + Non-current liabilities ($100,000) = $140,000.

    Total liabilities = $140,000.

  8. List shareholders' equity

    Share Capital $50,000, Retained Earnings $160,000. Sum = $210,000.

    Total equity = $210,000.

  9. Verify the accounting equation

    Assets ($350,000) should equal Liabilities ($140,000) + Equity ($210,000). $350,000 = $350,000, so it balances.

    The equation holds.

  10. Compute working capital

    Working capital = Current assets - Current liabilities = $100,000 - $40,000 = $60,000. Positive working capital means the company can cover short-term obligations.

    Working capital is a liquidity measure, not profitability. A positive number is generally good, but very large may indicate inefficiency.

Check yourself

Test your understanding of the balance sheet structure.

1Multiple choiceChecked instantly

Which of the following best describes the accounting equation?

  • AAssets = Liabilities - Equity
  • BAssets = Liabilities + Equity
  • CAssets = Equity - Liabilities
  • DAssets + Liabilities = Equity
2Short answerMarked by AI

A company has total assets of $500,000 and total liabilities of $300,000. Is the company solvent? Explain your answer using the accounting equation.

Graded on Correct identification of solvency · Applies the accounting equation

3Fill the blanksChecked instantly

Lesson 14

Inventory valuation methods

You will be able to explain how FIFO, LIFO and weighted-average cost change the cost of goods sold and the inventory balance, and why the choice matters in a period of rising prices. Covers the LIFO reserve and the lower-of-cost-or-market rule. Prevents comparing gross margins across companies with different inventory methods without adjusting.

30 min2 assessments

You open the annual reports of two home-furnishing retailers. Both sell the exact same sofas from the same factory, yet one reports a gross margin of 42% and the other reports 38%. The difference is not efficiency or pricing—it's how they value the sofa sitting in their warehouse.

Inventory valuation is the accounting rule that decides which cost flows into the cost of goods sold (COGS) and which stays on the balance sheet as inventory. The three main methods—FIFO (first-in, first-out), LIFO (last-in, first-out), and weighted-average cost—produce different COGS and ending inventory numbers when purchase prices change. That means the method you choose directly affects reported profit, income taxes, and key ratios like gross margin and inventory turnover.

This lesson gives you the tools to read any company's inventory note, adjust for method differences, and apply the lower-of-cost-or-market rule that keeps inventory from being overstated.

The choice among FIFO, LIFO, and weighted-average matters most when purchase prices are moving. The table below shows how each method behaves in a period of rising prices.

FIFO

Cost flow assumption
First units purchased are first ones sold
COGS when prices rise
Lowest (oldest, cheapest costs)
Ending inventory when prices rise
Highest (newest, more expensive costs)
Effect on net income (rising prices)
Highest reported net income
Tax effect (rising prices)
Highest taxable income (no tax deferral)
Allowed under IFRS?
Yes

Best for Companies that want to show higher earnings to investors or lenders, and those operating in stable or falling-price environments.

LIFO

Cost flow assumption
Last units purchased are first ones sold
COGS when prices rise
Highest (newest, more expensive costs)
Ending inventory when prices rise
Lowest (oldest, cheapest costs)
Effect on net income (rising prices)
Lowest reported net income
Tax effect (rising prices)
Lowest taxable income (tax deferral in rising prices)
Allowed under IFRS?
No (US GAAP only)

Best for US-based companies that want to minimize current income taxes and can justify the administrative cost of tracking LIFO layers.

Weighted-Average

Cost flow assumption
All units pooled; average cost per unit
COGS when prices rise
Between FIFO and LIFO
Ending inventory when prices rise
Between FIFO and LIFO
Effect on net income (rising prices)
Between FIFO and LIFO
Tax effect (rising prices)
Intermediate tax effect
Allowed under IFRS?
Yes

Best for Companies with homogeneous, interchangeable goods (fuel, grain, commodities) where tracking individual layers is impractical.

FIFO vs LIFO vs Weighted-Average: One purchase pattern, three results

Data

  • Beginning inventory: 100 units @ $10 each = $1,000
  • Purchase 1 (March): 200 units @ $12 each = $2,400
  • Purchase 2 (July): 150 units @ $14 each = $2,100
  • Units sold during the year: 300 units

FIFO

  • Sold first the 100 units @ $10, then 200 units @ $12 = COGS = 100×10 + 200×12 = $1,000 + $2,400 = $3,400
  • Ending inventory: 150 units @ $14 = $2,100 (the last purchase remains)
  • Gross profit (assuming revenue $6,000): $6,000 - $3,400 = $2,600

LIFO

  • Sold first the 150 units @ $14, then 150 units @ $12 = COGS = 150×14 + 150×12 = $2,100 + $1,800 = $3,900
  • Ending inventory: 100 units @ $10 + 50 units @ $12 = $1,000 + $600 = $1,600
  • Gross profit: $6,000 - $3,900 = $2,100

Weighted-Average

  • Total units: 100 + 200 + 150 = 450; total cost: $1,000 + $2,400 + $2,100 = $5,500
  • Average cost per unit: $5,500 ÷ 450 ≈ $12.2222
  • COGS: 300 × $12.2222 ≈ $3,666.67
  • Ending inventory: 150 × $12.2222 ≈ $1,833.33
  • Gross profit: $6,000 - $3,666.67 = $2,333.33

Key takeaway In this rising-price scenario, FIFO reports the highest profit and LIFO the lowest. The choice is not about reality—it's an accounting convention with real tax and ratio consequences.

Common misconception

“LIFO is always better because it reduces taxes, so every company should use it.”

In a period of rising prices, LIFO does produce a higher COGS, lower net income, and therefore lower income tax. That looks like a permanent advantage.

What is actually true

LIFO is only available under US GAAP—IFRS companies cannot use it. It also produces an older, lower inventory valuation that may require a LIFO reserve to be reported for comparability. In falling prices LIFO backfires, increasing taxes. Moreover, managing LIFO layers is costly and can distort profit if inventory levels drop (LIFO liquidation). The 'best' method depends on a company's specific tax situation, industry, and reporting goals.

Check yourself

Check your understanding of inventory valuation methods.

1Select all that applyChecked instantly

Which of the following inventory valuation methods are permissible under IFRS? (Select all that apply.)

  • AFIFO (First-In, First-Out)
  • BLIFO (Last-In, First-Out)
  • CWeighted-Average Cost
  • DSpecific Identification (for unique items)
2Short answerMarked by AI

A US company uses LIFO and reports a LIFO reserve of $40 million at year-end. Its gross margin under LIFO is 30%. Explain how an analyst can use the LIFO reserve to estimate what the gross margin would be if the company had used FIFO. Assume the reserve increased by $5 million during the year.

Graded on Identifies the LIFO reserve as the cumulative adjustment needed to restate inventory to FIFO basis. · Applies the conversion correctly to gross margin estimation. · Addresses the stated reserve amount and its change.

Lesson 15

Depreciation and amortization

You will be able to explain why a profitable company reports a non-cash expense and how straight-line differs from accelerated methods. Covers useful life, residual value and the impact on net book value. Prevents the mistake of adding back all depreciation without asking what maintenance capex is.

25 min3 assessments

You've already read the balance sheet and seen that a company's assets include things like buildings, equipment, and vehicles. But those assets don't stay new forever. The company uses them up over time, and accounting needs a way to spread that cost across the years those assets produce revenue. That's depreciation (for tangible assets) and amortization (for intangible ones).

Here's the key twist: depreciation is a non-cash expense. The cash left the company the day it bought the asset. The depreciation entry on the income statement is just an allocation of that past cost. Net income goes down, but cash doesn't change. That's why you'll see references to EBITDA (Earnings Before Interest, Taxes, Depreciation, and Amortization) — it tries to isolate cash earnings by adding back that non-cash charge.

But there's a trap. If you add back all depreciation without asking whether the company will need to spend cash to replace the asset one day, you overstate the cash available. Maintenance capital expenditure is the real cash cost of keeping assets productive. A good analyst compares depreciation to actual capex.

A factory machine costs $50,000. It has a useful life of 5 years and a residual (salvage) value of $5,000. Compute the annual depreciation expense using straight-line and double-declining balance (DDB) methods. Show the net book value at the end of each year.

  1. 1

    Straight-line: (Cost – Residual value) / Useful life = ($50,000 – $5,000) / 5 = $45,000 / 5

    The depreciable base is the cost minus what you'll get back at the end (residual value). Divide by the number of years.

1/7
Try it

Drag the useful life slider from 3 to 10. Notice how the straight-line annual depreciation drops smoothly, but the DDB total over the life is always the same (the depreciable base). Try increasing the residual value — what happens to the net book value after the full life? Also, watch the DDB total: it should equal the depreciable base minus a small adjustment in the last year. The playground shows that total DDB depreciation always equals the straight-line total over the full life; the difference is timing.

50000 $
5 years
5000 $

Straight-line annual depreciation / DDB total depreciation / Net book value after life

—

This browser cannot run the calculation (Web Workers are unavailable).

  • Depreciation allocates the cost of a tangible asset over its useful life; it is a non-cash expense.
  • Straight-line depreciation spreads the cost evenly each year: (Cost – Residual) / Useful life.
  • Accelerated methods (e.g., double-declining balance) take larger expenses in early years, reducing net income more initially.
  • Net book value = original cost minus accumulated depreciation; it never goes below residual value.
  • Adding back depreciation (as in EBITDA) overstates cash if the company does not spend enough on maintenance capex to keep assets productive.
  • Amortization is the same concept for intangible assets (patents, software).
Common misconception

“Depreciation is a way for companies to save on taxes, so they record it to get a tax benefit, but it's not a real expense.”

Depreciation is indeed a tax-deductible expense, and it reduces reported profit without any cash leaving the company in that period. The idea 'non-cash = not real' is seductive.

What is actually true

Depreciation is a real economic cost — the asset wore out and will need to be replaced. The cash outflow happened when the asset was purchased, so the expense recognition is just delayed. The tax benefit is real, but the underlying cost is also real. The mistake is confusing 'non-cash' with 'no cost.'

Check yourself

Check your understanding of depreciation methods and their implications.

1Multiple choiceChecked instantly

A company buys a machine for $100,000 with a residual value of $10,000 and a useful life of 5 years. Which depreciation method will produce the highest net income in the first year?

  • AStraight-line
  • BDouble-declining balance
  • CSum-of-years-digits
  • DUnits of production
2Numeric answerChecked instantly

A delivery truck costs $40,000, has a residual value of $4,000, and a useful life of 8 years. Using straight-line depreciation, what is the annual depreciation expense in dollars? Enter only the number.

3Short answerMarked by AI

A company reports net income of $200,000 and depreciation expense of $50,000. An investor says, 'That means the company really earned $250,000 in cash.' Briefly explain why this statement is misleading and what the investor should also examine.

Graded on Correctly identifies the non-cash nature of depreciation and the need to consider maintenance capex · Clarity and precision of explanation · Use of specific numbers from the prompt

Lesson 16

FIFO

First-in, first-out: assumes oldest inventory is sold first, leading to lower COGS and higher profit in rising prices.

5 min4 assessments

FIFO stands for First-In, First-Out. It assumes that the oldest inventory items are sold first. In a period of rising prices, this means the cost of goods sold (COGS) is made up of older, cheaper costs, while the ending inventory consists of newer, more expensive costs.

Because COGS is lower, net income is higher under FIFO compared to LIFO or weighted-average in a rising price environment. This also leads to a higher tax liability, but for financial reporting, FIFO is the default method under IFRS and is widely used. It also tends to match the physical flow of goods for perishable items (e.g., groceries), where the oldest stock is sold first to avoid spoilage.

You already know that inventory valuation methods affect COGS and inventory balances. FIFO is the most common choice because it reports inventory at current costs and avoids the write-downs that LIFO can require.

  • FIFO assumes the oldest inventory is sold first.
  • In rising prices, FIFO results in lower COGS and higher net income than LIFO.
  • Ending inventory under FIFO is valued at the most recent purchase costs.
  • FIFO is required under IFRS and allowed under US GAAP.
  • FIFO typically matches the physical flow for perishable goods.
  • Higher net income under FIFO means higher income tax expense in rising prices.

FIFO Calculation

Given:

  • Beginning inventory: 100 units @ $10 each
  • Purchase 1: 100 units @ $12 each
  • Sales: 150 units

FIFO steps:

  1. 1.Sell the oldest units first: 100 units from beginning inventory at $10 = $1,000
  2. 2.Then sell the next oldest: 50 units from Purchase 1 at $12 = $600
  3. 3.Total COGS = $1,000 + $600 = $1,600
  4. 4.Ending inventory: remaining 50 units from Purchase 1 at $12 = $600

Under LIFO, COGS would be higher (100×$12 + 50×$10 = $1,700) and ending inventory lower ($500).

Practice
0/8 known
1 / 8
Reference

FIFO in a Nutshell

Assumption

FIFO
Oldest inventory sold first

COGS in rising prices

FIFO
Lower (older costs)

Ending inventory in rising prices

FIFO
Higher (recent costs)

Net income in rising prices

FIFO
Higher than LIFO

Tax liability in rising prices

FIFO
Higher (due to higher profit)

Physical flow match

FIFO
Good for perishable goods

IFRS status

FIFO
Default method; required under IFRS

FIFO is the most common inventory valuation method for financial reporting.

Check yourself

Check your understanding of FIFO.

1Multiple choiceChecked instantly

In a period of rising prices, which of the following is true about FIFO?

  • ACOGS is higher than under LIFO.
  • BNet income is higher than under LIFO.
  • CEnding inventory is valued at older costs.
  • DCOGS reflects the most recent purchase prices.
2Fill the blanksChecked instantly
3Numeric answerChecked instantly

A company has beginning inventory of 50 units at $5 each. It purchases 50 units at $7 each. It sells 60 units. What is the cost of goods sold under FIFO? (Enter the number only, no dollar sign.)

4Select all that applyChecked instantly

Which of the following are true about FIFO? (Select two.)

  • AIt assumes the newest inventory is sold first.
  • BIn rising prices, it leads to higher net income than LIFO.
  • CIt is not allowed under IFRS.
  • DEnding inventory reflects the most recent purchase costs.
  • EIt matches the physical flow for perishable goods.

Lesson 17

LIFO

Last-in, first-out: assumes newest inventory is sold first, leading to higher COGS and lower profit in rising prices (not allowed under IFRS).

5 min3 assessments

LIFO (Last-In, First-Out) is an inventory valuation method that assumes the most recently purchased items are sold first. In a period of rising prices, this means cost of goods sold (COGS) reflects the highest recent costs, while the ending inventory on the balance sheet is valued at older, lower costs. The result: lower reported profit and lower taxable income. LIFO is not permitted under IFRS (International Financial Reporting Standards), so it is only used by companies reporting under US GAAP. The choice to use LIFO is primarily driven by tax savings in the US, where LIFO is allowed for tax purposes if also used for financial reporting. However, it can distort the balance sheet, as inventory values may be significantly understated compared to current replacement costs.

  • LIFO assumes newest inventory is sold first.
  • In rising prices, LIFO yields higher COGS and lower net income.
  • LIFO reduces taxable income, providing a tax benefit.
  • LIFO is not allowed under IFRS, only US GAAP.
  • LIFO can cause inventory on the balance sheet to be undervalued.
  • LIFO is a method of costing inventory, not a physical flow assumption.
Practice
0/8 known
1 / 8
Reference

LIFO Key Facts

Definition

LIFO
Assumes newest inventory items are sold first

Effect on COGS (rising prices)

LIFO
Higher COGS (uses recent, higher costs)

Effect on Ending Inventory (rising prices)

LIFO
Lower inventory value (old, lower costs)

Effect on Net Income (rising prices)

LIFO
Lower net income (higher COGS)

Tax Benefit

LIFO
Reduces taxable income, lowers tax expense

Allowed under IFRS

LIFO
No

Allowed under US GAAP

LIFO
Yes

Physical Flow Assumption

LIFO
Not necessarily, it's a costing method, not flow

Use this table to quickly recall how LIFO differs from other methods in key areas.

Check yourself

Test your understanding of LIFO.

1Multiple choiceChecked instantly

A company uses LIFO in a period of rising prices. Which of the following is true about its financial statements compared to FIFO?

  • ACOGS is lower
  • BNet income is higher
  • CTaxable income is lower
  • DInventory is higher
2Fill the blanksChecked instantly
3Select all that applyChecked instantly

Which of the following are characteristics of LIFO? (Select all that apply)

  • AAssumes oldest inventory sold first
  • BResults in higher COGS during rising prices
  • CPermitted under IFRS
  • DCan lead to undervalued inventory on balance sheet
  • EProvides tax benefit in rising prices

Lesson 18

Weighted-average cost

Averages the cost of all units, smoothing price changes over the period.

5 min3 assessments

When you buy identical inventory items at different prices, which cost should you assign to the unit you sell? The weighted-average cost method (WAC) sidesteps the choice by averaging all costs.

How it works

At the end of a period, you calculate the weighted-average cost per unit once:

code1 line
Weighted-average cost per unit = Total cost of goods available for sale ÷ Total units available for sale

Then you value every unit — whether sold or still in stock — at that same average cost.

A concrete example

Your beginning inventory is 100 units costing $10 each ($1,000 total). You buy another 200 units at $12 each ($2,400 total). You sell 150 units.

  • Total cost available = $1,000 + $2,400 = $3,400
  • Total units available = 100 + 200 = 300
  • Average cost per unit = $3,400 ÷ 300 = $11.33 (rounded)
  • Cost of goods sold (COGS) = 150 × $11.33 = $1,699.50
  • Ending inventory = 150 × $11.33 = $1,699.50

Why use it?

WAC smooths out price spikes. It's the simplest method when inventory is homogeneous (e.g., fuel, grain, identical components) and you don't want the income statement bouncing with every purchase. If you're choosing between FIFO, LIFO and WAC, and prices are moderately volatile, WAC often gives a more predictable profit margin.

Reference

Weighted-Average Cost — Step-by-Step Reference

1. Find total cost

Description
Add beginning inventory cost and all purchases during the period.
Example (using numbers above)
$1,000 + $2,400 = $3,400

2. Find total units

Description
Add beginning inventory units and all purchases during the period.
Example (using numbers above)
100 + 200 = 300 units

3. Compute average cost per unit

Description
Divide total cost by total units.
Example (using numbers above)
$3,400 ÷ 300 = $11.33

4. Value COGS

Description
Multiply units sold by average cost.
Example (using numbers above)
150 × $11.33 = $1,699.50

5. Value ending inventory

Description
Multiply units remaining by average cost.
Example (using numbers above)
150 × $11.33 = $1,699.50

The average cost per unit is calculated only at period-end, not per transaction. If more purchases occur later, the average updates.

WAC with a mid-period purchase

Scenario

A hardware store starts January with 50 bags of cement at $8 each ($400). On Jan 10 it buys 100 bags at $9 each ($900). On Jan 20 it buys 150 bags at $10 each ($1,500). It sells 200 bags during the month.

Step 1 – Total cost available

$400 + $900 + $1,500 = $2,800

Step 2 – Total units available

50 + 100 + 150 = 300 bags

Step 3 – Weighted-average cost per unit

$2,800 ÷ 300 = $9.33 (rounded to two decimals)

Step 4 – Value the goods sold

COGS = 200 bags × $9.33 = $1,866

Step 5 – Value ending inventory

Ending inventory = 100 bags remaining × $9.33 = $933

Check: $1,866 + $933 = $2,799 (rounding accounts for the $1 difference).

What if you used FIFO?

Under FIFO the first 200 units sold would come from the $8 and $9 batches, giving COGS of about $1,700 and ending inventory of $1,100. WAC produced a COGS of $1,866 — a more conservative profit figure because it spread the recent $10 cost across all units.

Practice
0/6 known
1 / 6
Check yourself

Check your understanding of weighted-average cost.

1Multiple choiceChecked instantly

A company has beginning inventory of 200 units at $5 each and purchases 300 units at $7 each. If it sells 400 units, what is the cost of goods sold using the weighted-average cost method? (Round average cost to two decimal places.)

  • A$2,400
  • B$2,480
  • C$2,520
  • D$2,600
2Fill the blanksChecked instantly
3Select all that applyChecked instantly

Which of the following are true about the weighted-average cost method? (Select all that apply.)

  • AIt results in the same cost per unit for all units sold and remaining.
  • BIt typically produces a COGS that lies between FIFO and LIFO when prices are changing.
  • CIt requires tracking each purchase separately to assign costs to specific units.
  • DIt is well-suited for homogeneous inventory items.

Lesson 19

Straight-line depreciation

Spreads the cost evenly over the asset's useful life.

5 min3 assessments

Straight-line depreciation spreads an asset's cost evenly over its useful life. It is the default choice for most financial statements because it is simple, predictable, and matches the steady consumption of many assets (like office furniture or buildings).

The formula is:

Annual Depreciation Expense = (Cost – Residual Value) ÷ Useful Life

  • Cost is what you paid to acquire and prepare the asset (purchase price, shipping, installation).
  • Residual Value (or salvage value) is the expected amount you could sell the asset for at the end of its life.
  • Useful Life is the number of years the asset will be used in the business.

Every year, the same dollar amount is expensed on the income statement, and the asset's net book value on the balance sheet falls by that amount.

  • Straight-line depreciation allocates the same expense each year of the asset's useful life.
  • Annual expense = (Cost – Residual Value) ÷ Useful Life.
  • It is the simplest method and the default for most financial reporting under GAAP and IFRS when no better method fits.
  • Depreciation is a non-cash expense: it reduces reported profit but does not involve an outflow of cash.
  • Net book value at year-end = Cost – Accumulated Depreciation (sum of all years' depreciation so far).
Reference

Common asset useful lives and typical residual values for straight-line depreciation

Office furniture

Typical useful life (years)
7–10
Typical residual value (% of cost)
0–10

Vehicles (light trucks)

Typical useful life (years)
5
Typical residual value (% of cost)
20–30

Computers and IT equipment

Typical useful life (years)
3–5
Typical residual value (% of cost)
0–5

Leasehold improvements

Typical useful life (years)
5–10 (or lease term, whichever shorter)
Typical residual value (% of cost)
0

Buildings (commercial)

Typical useful life (years)
27.5 (residential) / 39 (commercial)
Typical residual value (% of cost)
10–20

Machinery

Typical useful life (years)
10–15
Typical residual value (% of cost)
5–15

Residual value is often estimated; if it is immaterial, it may be treated as zero.

Straight-line depreciation calculation

A company buys a delivery truck for $45,000. It expects to use it for 5 years and then sell it for about $5,000.

  • Cost = $45,000
  • Residual value = $5,000
  • Useful life = 5 years

Annual depreciation = ($45,000 – $5,000) ÷ 5 = $40,000 ÷ 5 = $8,000 per year

Yearly impact on financial statements:

YearDepreciation expense (Income Statement)Accumulated depreciation (Balance Sheet)Net book value of truck (Cost – Accum. dep.)
1$8,000$8,000$37,000
2$8,000$16,000$29,000
3$8,000$24,000$21,000
4$8,000$32,000$13,000
5$8,000$40,000$5,000

After 5 years, net book value equals residual value ($5,000), and no more depreciation is recorded if the asset continues to be used.

Practice
0/7 known
1 / 7
Check yourself

Check your understanding of straight-line depreciation.

1Fill the blanksChecked instantly
2Multiple choiceChecked instantly

A company buys a machine for $20,000 with an estimated residual value of $2,000 and a useful life of 6 years. What is the annual straight-line depreciation expense?

  • A$3,333
  • B$3,000
  • C$18,000
  • D$20,000
3Select all that applyChecked instantly

Which of the following statements about straight-line depreciation are correct? (Select all that apply.)

  • ADepreciation expense is highest in the first year
  • BAccumulated depreciation increases by the same amount each year
  • CNet book value decreases by a constant dollar amount each year
  • DDepreciation is recorded as a cash outflow in the cash flow statement
  • EIf residual value is zero, the entire cost is depreciated over the useful life
  • FStraight-line is the only method allowed under GAAP

Lesson 20

Declining-balance depreciation

Accelerates depreciation, taking larger expenses in early years.

5 min4 assessments

Declining-balance depreciation accelerates the expense, taking larger charges in the early years of an asset's life. Unlike straight-line, it does not subtract residual value from the cost at the start. Instead, annual depreciation = book value at the beginning of the year × a fixed rate (often 200% of the straight-line rate, called double-declining balance). Depreciation stops once the book value reaches the residual value.

This method matches expense to revenue when the asset generates more value early on — for example, a delivery truck. Compared to straight-line, it reduces reported income (and taxes) in the early years and increases it later.

Use this method when the asset's economic benefit declines over time. If benefits are steady, stay with straight-line.

Double-Declining Balance on a $10,000 Asset

Cost: $10,000, Useful life: 5 years, Residual value: $1,000.

Straight-line rate = 100% / 5 = 20%. Double-declining rate = 40%.

  • Year 1: Book value $10,000 × 40% = $4,000 depreciation. Book value end = $6,000.
  • Year 2: $6,000 × 40% = $2,400. Book value = $3,600.
  • Year 3: $3,600 × 40% = $1,440. Book value = $2,160.
  • Year 4: $2,160 × 40% = $864. Book value = $1,296.
  • Year 5: Depreciation limited to bring book value to $1,000 residual: $1,296 - $1,000 = $296.

Total depreciation: $4,000 + $2,400 + $1,440 + $864 + $296 = $9,000 (cost minus residual). Early years bear the largest expense.

Practice
0/8 known
1 / 8
Reference

Comparison of Straight-Line and Declining-Balance Depreciation

Depreciation pattern

Straight-Line
Equal each year
Declining-Balance
Decreases each year

Formula

Straight-Line
(Cost - Salvage) / Life
Declining-Balance
Book value × Rate

Early net income impact

Straight-Line
Higher (lower expense)
Declining-Balance
Lower (higher expense)

Best for

Straight-Line
Assets with consistent benefit
Declining-Balance
Assets with high early benefit

Salvage value treatment

Straight-Line
Deducted from cost
Declining-Balance
Not deducted initially; acts as floor

The declining-balance rate is often 150% or 200% of the straight-line rate.

Check yourself

Test your understanding of declining-balance depreciation.

1Multiple choiceChecked instantly

In the double-declining balance method, the highest depreciation expense occurs in which year?

  • AFirst year
  • BLast year
  • CMiddle year
  • DAll years are equal
2Fill the blanksChecked instantly
3Fill the blanksChecked instantly
4Select all that applyChecked instantly

Which of the following statements about declining-balance depreciation are true? (Select all that apply.)

  • AIt records higher depreciation expense in the early years.
  • BIt is an accelerated depreciation method.
  • CThe depreciation rate is always 200% of the straight-line rate.
  • DResidual value is always ignored until the asset is sold.

Lesson 21

Current vs non-current assets and liabilities

Defines current (within one year) and non-current classifications and why they matter for liquidity analysis.

10 min3 assessments

You can already read a balance sheet as a list of what a company owns and owes. The next question is when it owns and owes it. A company that owns plenty but owns it all in machines it can't sell quickly can still run out of cash before payday. That's why every balance sheet splits each side into two buckets:

  • Current — cash, or things that will turn into cash, or obligations that must be paid, within one operating cycle, usually one year.
  • Non-current — things you'll still be using or still be paying off more than a year out.

On the asset side, current means liquidity: inventory that will sell, receivables customers will pay, cash itself, and short-term investments you could liquidate. Non-current assets are the long-lived productive base — property, plant, equipment, patents, and what you paid above book value for an acquisition (goodwill).

On the liability side, current means obligations due within the year: supplier invoices, wages owed, short-term loans, and the slice of a long-term loan that's due this year. Non-current liabilities are the debts with maturities beyond a year — the rest of that loan, bonds, deferred tax.

The classification is about timing, not size. Amazon carries billions of non-current assets and still runs a positive working capital position. A startup with one million in current assets and one point two million in current liabilities is technically healthy on paper except for the fact that the shortfall is due soon. Subtracting current liabilities from current assets gives working capital — the cushion a business has to keep paying its bills while it waits for its inventory to become cash. The ratio form, current assets ÷ current liabilities, is the current ratio; above 1 means the current bucket covers the due bucket.

One trap: a single line can straddle the boundary. The current portion of long-term debt is the chunk of a 10-year loan due in the next 12 months, and it is reclassified as current even though the rest of the loan stays non-current. Miss that line and your liquidity picture looks too good by exactly the amount you must pay next year.

Every balance sheet line lands in one of four buckets, decided by the one-year timing test.

Analogy

Think of the balance sheet as a household budget split into what's in your wallet this week and what's tied up in the rest of your life. Current assets are the cash in your wallet plus this week's pay that's already on its way; current liabilities are the rent and phone bill due before the month ends. Non-current assets are your house and your education; non-current liabilities are your 30-year mortgage and your student loan. Your 'working capital' is whether the money coming in this week covers what must go out this week, no matter how big your house is.

Where the analogy breaks down

A household can refuse to pay a bill or sell a house and suffer only reputation damage and a headache; a company that fails to pay a valid current liability can be forced into bankruptcy by its creditors, and its non-current assets are often worth far less than book value when sold under pressure. The categories also stay fixed on a balance sheet but drift in real life — inventory that hasn't sold in 18 months is still labelled current, while your week-old leftovers are not on any statement.

Same customers, opposite health — the timing test in action

Two small manufacturers, BoltWorks and FrameCo, both have total assets of 1,000,000 and total liabilities of 600,000. Net assets are identical. Only the split differs.

LineBoltWorksFrameCo
Cash80,00020,000
Inventory120,00060,000
Receivables100,00040,000
Current assets300,000120,000
Machinery, land, intangibles700,000880,000
Total assets1,000,0001,000,000
Payables (due in 30 days)90,00090,000
Current portion of long-term debt60,00060,000
Current liabilities150,000150,000
Long-term debt450,000450,000
Total liabilities600,000600,000

Compute working capital and the current ratio for each:

  • BoltWorks: 300,000 − 150,000 = 150,000 working capital; 300,000 ÷ 150,000 = 2.0 current ratio.
  • FrameCo: 120,000 − 150,000 = −30,000 working capital; 120,000 ÷ 150,000 = 0.8 current ratio.

FrameCo owes 150,000 within the year but expects only 120,000 in cash to arrive. It must sell machinery, delay suppliers, or find a new loan just to keep the lights on — despite reporting the same total assets and the same profit story. Reading only totals, you'd call them twins; reading the current split, you'd call one healthy and one distressed.

  • Current assets are cash and items expected to convert to cash within the operating cycle (usually one year).
  • Non-current assets are long-lived resources held for more than a year — property, plant, equipment, intangibles.
  • Current liabilities are obligations due within one year; non-current liabilities mature beyond one year.
  • The current portion of long-term debt is stripped out and classified as a current liability.
  • Working capital = current assets − current liabilities; the current ratio = current assets ÷ current liabilities.
  • A current ratio above 1 means current assets cover current liabilities; below 1 signals a possible cash crunch within the year.
  • Classification is about timing, not size or importance — a billion-dollar factory is still non-current.
Check yourself

Four quick checks on the timing test.

1Multiple choiceChecked instantly

A company signs a 10-year loan of 5 million. The repayment schedule requires 500,000 in the coming year. How does the balance sheet classify this loan at the reporting date?

  • AAll 5 million as non-current liabilities, since the loan matures in 10 years.
  • BAll 5 million as current liabilities, since the loan is still outstanding.
  • C500,000 as a current liability and 4,500,000 as a non-current liability.
  • D500,000 as a current liability and 4,500,000 as a current asset, offsetting each other.
2Short answerMarked by AI

Using the current/non-current split, explain why a company with total assets of 10 million and a current ratio of 0.7 can still be in financial trouble despite its size. Name the two numbers you would compute and what they tell you.

Graded on Computes or names working capital and current ratio from a ratio of 0.7 · Explains why large total assets do not rescue the company · Names both numbers requested and what they indicate

3Short answerMarked by AI

Which balance sheet line is classified as a current liability even though the original loan is long-term?

For you · never graded

Pull up the latest balance sheet of a company you know. Which single line tells you the most about whether it could survive a sudden stop in new sales? Would you rather see a high current ratio or a high proportion of current assets in cash — and why?

Lesson 22

Working capital

Explains working capital as current assets minus current liabilities and its role in day-to-day operations.

10 min3 assessments

Working capital measures the cash and near-cash resources a company has to run its day-to-day operations. The formula is simple: Current Assets – Current Liabilities. Current assets include cash, accounts receivable, and inventory. Current liabilities include accounts payable, short-term debt, and accrued expenses.

Positive working capital means the company can cover its short-term obligations with the assets it expects to convert to cash within a year. Negative working capital signals a liquidity squeeze – the company may struggle to pay suppliers or employees. However, some businesses (like retailers) can operate with negative working capital because they collect cash from customers before paying their own bills. The key is to compare working capital across time and against industry peers.

Working capital isn't a perfect measure on its own. A company with very high working capital may be hoarding cash or carrying too much inventory, which drags on returns. The goal is to keep working capital at a level that supports operations without wasting resources.

  • Working capital = Current Assets – Current Liabilities.
  • Positive working capital indicates the company can meet short-term obligations.
  • Negative working capital is a liquidity warning, though some business models (e.g., retail) can sustain it.
  • Very high working capital may signal inefficiency – too much cash or inventory.
  • Working capital trends over time matter more than a single snapshot.
  • Working capital is part of the broader cash conversion cycle (not covered here).
Go deeper

Read the Wikipedia article on financial capital for a broader view of how working capital fits into a company's capital structure.

A company reports the following balance sheet figures (in € thousands):

  • Current assets: Cash €50, Accounts receivable €120, Inventory €80
  • Current liabilities: Accounts payable €90, Short-term debt €30, Accrued expenses €20

Calculate the company's working capital and interpret the result.

  1. 1

    Total current assets = 50 + 120 + 80 = 250

    Sum all items classified as current assets.

1/4
Try it

Drag the sliders to explore how working capital changes. Notice that when Current Liabilities exceeds Current Assets, working capital becomes negative – a sign of potential liquidity trouble. What happens if you increase both sliders by the same amount? (Hint: the difference stays the same.) Also, try setting Current Assets to 800 and Current Liabilities to 600 – the working capital is 200. Now, if you increase both by 100, the working capital remains 200. That shows that growing the balance sheet symmetrically doesn't improve liquidity.

500 $000
200 $000

Working Capital

—

This browser cannot run the calculation (Web Workers are unavailable).

Check yourself

Test your understanding of working capital with these questions.

1Multiple choiceChecked instantly

Which of the following is the correct definition of working capital?

  • ATotal assets minus total liabilities
  • BCurrent assets minus current liabilities
  • CCash inflows minus cash outflows
  • DRevenue minus expenses
2Numeric answerChecked instantly

A company has current assets of $2,500,000 and current liabilities of $1,800,000. What is its working capital in dollars? (Enter only the number, e.g., 700000)

3Short answerMarked by AI

Explain why a company with consistently negative working capital might be at risk, and give one example of a business model where negative working capital is normal.

Graded on Identifies the risk of negative working capital · Provides a valid example of a business model with normal negative working capital

Lesson 23

Shareholders' equity

Covers common stock, retained earnings, and other components of equity, and how it represents owners' claim.

10 min4 assessments

From the balance sheet you already know that assets minus liabilities equals shareholders' equity. That number is the owners' residual claim—what would be left if the company paid off everything it owes. But equity isn't one pile of money; it's built from several accounts that each tell a different story.

Common stock and additional paid-in capital – When a company sells shares to investors, the par value (a nominal amount like $0.01 per share) goes into common stock. Any amount above par goes into additional paid-in capital (APIC). Together they represent the capital contributed by shareholders.

Retained earnings – This is the accumulated net income that the company has kept, minus any dividends paid. It links the income statement to the balance sheet: profit flows into retained earnings, and losses reduce it.

Treasury stock – When a company buys back its own shares, it records this as a negative amount in equity. It reduces the total equity because the company is returning capital to shareholders.

Other components – Some companies have accumulated other comprehensive income (unrealized gains/losses on investments, foreign currency translation, etc.) and noncontrolling interest (the portion of a subsidiary not owned by the parent). These are beyond your immediate scope, but know they exist.

Equity is a book value—it reflects historical transactions and accounting rules, not what the company is worth today on the stock market.

Components of shareholders' equity. Treasury stock reduces total equity.

Analogy

Think of shareholders' equity as your home equity. If your house is worth $300,000 and you still owe $200,000 on the mortgage, your equity is $100,000. That's your net claim. Similarly, a company's equity is the net claim of owners after subtracting all liabilities from assets.

Contributed capital is like the down payment you made. Retained earnings are like the extra principal you've paid off over time. Treasury stock is like taking cash out of your equity by refinancing—it reduces your net stake.

Where the analogy breaks down

A company's market value can be wildly different from its book equity. Your house's market value directly determines your equity, but a company's stock price depends on future earnings expectations, not just past transactions. Also, you can spend your home equity by taking out a loan—a company cannot 'spend' its retained earnings; it spends cash, and equity is just a historical record.

  • Shareholders' equity = Total assets − Total liabilities.
  • Common stock + Additional paid-in capital = What shareholders originally paid in (par + premium).
  • Retained earnings = All net income kept in the business, minus all dividends ever paid.
  • Treasury stock is a negative equity account that reduces total equity when the company buys back shares.
  • Equity is a book value, not market value; the stock price often differs from book value per share.
  • Net income increases retained earnings, while net losses and dividends decrease them.
Common misconception

“Shareholders' equity is the amount of cash the company has available to pay dividends or invest.”

Retained earnings, a big part of equity, is literally profit kept in the business—so it must be cash, right? And dividends come from retained earnings.

What is actually true

Equity is an accounting measure, not a cash balance. Retained earnings represent the cumulative profit retained, but that profit may have been spent on equipment, inventory, or paying down debt. The cash account is a separate asset on the balance sheet. A company can have high retained earnings but zero cash.

Check yourself

Check your understanding of shareholders' equity.

1Multiple choiceChecked instantly

Which of the following transactions increases total shareholders' equity?

  • AThe company buys back 10,000 of its own shares.
  • BThe company reports net income of $5 million.
  • CThe company pays a cash dividend of $1 million.
  • DThe company purchases a new factory for $10 million cash.
2Short answerMarked by AI

Explain how retained earnings create a link between the income statement and the balance sheet. In your answer, describe what happens to retained earnings when a company reports a profit, and what happens when it pays dividends.

Graded on Identifies the flow of net income into retained earnings · Describes the effect of dividends · Explains the balance sheet connection

3Short answerMarked by AI

You are analyzing a company's balance sheet. It reports: total assets $500,000; total liabilities $300,000; common stock (par $0.01) $1,000; additional paid-in capital $99,000; retained earnings $150,000; treasury stock $50,000 (cost). Compute total shareholders' equity. Then, if the company reports a net loss of $20,000 and pays no dividends, what will retained earnings become? Explain how the equity components change.

Graded on Correct computation of total equity · Correct analysis of retained earnings change

4Short answerMarked by AI

Company A has shareholders' equity of $10 million consisting entirely of common stock and retained earnings (no treasury stock). Company B also has $10 million equity but includes $5 million of treasury stock (so contributed capital and retained earnings total $15 million before subtracting treasury stock). Both companies have the same assets and liabilities. Which company's equity structure suggests a healthier financial position? Justify your answer by considering the implications of treasury stock and the sources of equity.

Graded on Identifies the healthier company correctly · Justification using treasury stock implications · Justification using sources of equity

Lesson 24

Reading the cash flow statement

You will be able to trace the change in cash through operating, investing and financing activities and reconcile it to the income statement. Covers the indirect method, the cash conversion cycle and the meaning of negative operating cash flow. Prevents the belief that a growing profit always means a healthy business.

40 min2 assessments

Net income isn't cash. A company can report a healthy profit yet be strapped for cash because it spent money on inventory, bought equipment, or paid down debt. The cash flow statement is the bridge between the income statement’s accrual-based profit and the actual cash that moved in and out. It answers one question: Where did the cash come from, and where did it go?

It splits every cash movement into three buckets:

  • Operating activities – cash from selling goods and services, after adjusting for non-cash items like depreciation and changes in working capital.
  • Investing activities – cash spent on or received from long-term assets (equipment, acquisitions, investments).
  • Financing activities – cash from or repaid to lenders and shareholders (debt, equity, dividends).

When you add the net change from all three to the cash balance at the start of the period, you get the cash balance at the end – the same number you see on the balance sheet.

Structure of the cash flow statement (indirect method). Operating cash flow is derived from net income by adding back non-cash charges and adjusting for changes in working capital. Investing and financing sections are direct lists of cash flows.

Steps
0/6

Let's walk through the cash flow statement of BrightSpark Inc., a fictional electronics company. Its annual report shows the following (all figures in $ millions):

ItemAmount
Net income150
Depreciation & amortization40
Increase in accounts receivable(30)
Decrease in inventory10
Increase in accounts payable20
Purchase of property, plant & equipment(80)
Sale of old equipment15
Issuance of long-term debt50
Dividends paid(25)
Beginning cash balance100

Follow these steps to read the statement.

  1. Find the operating section

    Start with net income: 150. Then add back non-cash expenses: depreciation +40 → running total 190.

    Don't forget to add back depreciation; it's a non-cash charge that reduced net income but didn't consume cash.

    Your running total matches 190.

  2. Adjust for working capital changes

    Now apply the changes in current assets and liabilities:

    • Increase in AR: -30 → total 160
    • Decrease in inventory: +10 → total 170
    • Increase in AP: +20 → total 190

    Operating cash flow = 190

    An increase in AR means cash hasn't been collected yet – it reduces cash flow, even though revenue was recognized. Watch the sign carefully.

    Operating cash flow is 190.

  3. Identify investing activities

    List cash flows from long-term assets:

    • Purchase of PPE: -80
    • Sale of old equipment: +15

    Net investing cash flow = -65

    Capital expenditures (purchases) are almost always a cash outflow. A sale of equipment is unusual – include it only if it happened.

    Net investing is -65.

  4. Identify financing activities

    List cash flows from debt and equity:

    • Issuance of debt: +50
    • Dividends paid: -25

    Net financing cash flow = +25

    Dividends are a cash outflow; issuing debt is an inflow. Stock buybacks would also appear here as an outflow.

    Net financing is +25.

  5. Calculate net change in cash

    Add the three section totals: 190 (operating) + (-65) (investing) + 25 (financing) = 150 Net change in cash: +150.

    Double-check the sign: operating is positive, investing negative, financing positive. If the sum seems off, verify each section.

    Net change is 150.

  6. Reconcile to balance sheet

    Add net change to beginning cash: 100 + 150 = 250. This is the ending cash balance – it should match the cash line on the balance sheet.

    Ending cash balance is 250.

Reference

Common line items and their effect on cash flow

Operating

Line Item
Depreciation & amortization
Effect on Cash Flow
+ (add back)

Operating

Line Item
Increase in accounts receivable
Effect on Cash Flow
- (cash not collected)

Operating

Line Item
Decrease in inventory
Effect on Cash Flow
+ (cash freed up)

Operating

Line Item
Increase in accounts payable
Effect on Cash Flow
+ (cash not paid yet)

Operating

Line Item
Decrease in accounts payable
Effect on Cash Flow
- (cash paid out)

Investing

Line Item
Purchase of property, plant & equipment
Effect on Cash Flow
- (cash spent)

Investing

Line Item
Sale of equipment or investments
Effect on Cash Flow
+ (cash received)

Financing

Line Item
Issuance of debt or equity
Effect on Cash Flow
+ (cash received)

Financing

Line Item
Repayment of debt
Effect on Cash Flow
- (cash paid)

Financing

Line Item
Dividends paid
Effect on Cash Flow
- (cash paid)

Financing

Line Item
Stock buybacks
Effect on Cash Flow
- (cash paid)

Use this table as a quick reference when reading any cash flow statement.

  • The cash flow statement divides cash movements into operating, investing, and financing activities.
  • Operating cash flow starts with net income and adjusts for non-cash items (depreciation) and changes in working capital.
  • An increase in accounts receivable or inventory reduces operating cash flow; a decrease increases it.
  • Investing cash flow is usually negative because companies spend on long-term assets to grow.
  • Financing cash flow shows how the company raises or returns capital – debt, equity, dividends, buybacks.
  • The sum of the three sections plus the beginning cash balance equals the ending cash balance on the balance sheet.
Check yourself
1Short answerMarked by AI

You are analyzing the cash flow statement of a company. Here are the key figures (in thousands of dollars): Net income: $500; Depreciation: $100; Increase in accounts receivable: $200; Increase in inventory: $50; Increase in accounts payable: $80; Purchase of equipment: $600; Issuance of debt: $200; Dividends paid: $50. Beginning cash balance: $100; Ending cash balance: $80. Explain why the company's cash balance decreased despite reporting a net income of $500. Reference specific line items from each section (operating, investing, financing) and show your calculations.

Graded on Identifies the main reason for cash decrease (investing outflow) · Explains the impact of working capital changes · References specific numbers from the statement

2Short answerMarked by AI

You are comparing the cash flow statements of two companies, A and B, both in the same industry. Company A: Operating cash flow $2,000,000; Investing cash flow -$1,500,000 (primarily for new equipment); Financing cash flow $500,000 (from debt issuance). Company B: Operating cash flow $500,000; Investing cash flow -$200,000 (equipment maintenance); Financing cash flow -$300,000 (debt repayment and dividends). Both companies have similar net income. Which company is in a healthier financial position? Justify your choice by comparing the three sections of their cash flow statements.

Graded on Compares operating cash flow strength · Evaluates investing and financing activities in context · States a clear conclusion with justification

Lesson 25

Operating cash flow versus free cash flow

You will be able to compute free cash flow from the cash flow statement and explain why it is a better measure of discretionary cash than operating cash flow alone. Covers capital expenditures, maintenance versus growth capex, and the free cash flow yield. Prevents valuing a company on operating cash flow when it spends heavily on fixed assets.

20 min3 assessments

You already know how to read the cash flow statement; this node pits two of its numbers against each other. Operating cash flow (OCF) answers "did operations generate cash?" It does not answer "can the company hand that cash to shareholders?" A manufacturer can report $180M of OCF and still have nothing left over, because $170M went to replace aging machines. Free cash flow (FCF) is the adjustment that reveals what's left:

FCF = Cash from operations − Capital expenditures

Both numbers are already on the cash flow statement. Cash from operations is the bottom line of the operating section. Capital expenditures are in the investing section, usually as "purchases of property, plant and equipment." Not every investing outflow is capex: buying another company is an investing outflow, but FCF does not subtract it.

Read the sign carefully. Capex appears as a negative number on the statement; in the formula you subtract the absolute dollar amount. A positive OCF with larger capex gives negative FCF — the business generated cash but spent more than it generated on the assets it needs.

FCF is the cash available for dividends, share buybacks, debt repayment, acquisitions or a rainy-day balance. That is why it is called discretionary. OCF looks past the income statement's non-cash items; FCF looks one step further, past the cash the business must feed back into itself.

Northwind Manufacturing's 2024 cash flow statement shows net cash provided by operating activities: $184.0M and purchases of property, plant and equipment: $96.0M. Northwind has 50M shares outstanding at $22.00 per share. Compute free cash flow and free cash flow yield.

  1. 1

    FCF = OCF − CapEx

    Free cash flow starts from cash actually produced by operations, not from net income, because operations can be profitable while cash is tied up in receivables or inventory.

1/5
Reference

Capex categories when reading FCF

Maintenance capex

What it is
Spending to keep existing equipment and facilities running
How it hits FCF
Reduces FCF now; if deferred, current FCF is inflated and future FCF pays for the delay

Growth capex

What it is
Spending on new capacity or new lines of business
How it hits FCF
Reduces FCF now, but may grow future OCF; the cash is equally gone either way

Depreciation

What it is
Non-cash write-off of past capex on the income statement
How it hits FCF
Not an FCF deduction; sometimes used as a rough proxy for maintenance capex

The cash flow statement does not label capex as maintenance or growth — the split is your judgment, informed by management commentary and by comparing capex to depreciation.

Try it

Keep OCF at 180 and drag capex upward. FCF crosses zero exactly when capex reaches OCF — not when it reaches net income and not when the company stops being profitable. Push capex past 180 and the company still reports positive operating cash flow but has negative discretionary cash; any dividend that size would have to be borrowed or funded from cash reserves. Then lower OCF and watch the crossover move with it.

180 $M
96 $M

Free cash flow

—

This browser cannot run the calculation (Web Workers are unavailable).

Check yourself

Check the calculation, then reason about what FCF really measures.

1Numeric answerChecked instantly

A logistics company reports net cash from operating activities of $142.5M and cash paid for new trucks and terminals of $117.0M. What is its free cash flow in $M? Give your answer to at least one decimal place and include no units in the box.

2Short answerMarked by AI

A retailer reports operating cash flow of $380M and capital expenditures of $310M. Management says it is postponing equipment replacements to keep reported free cash flow high. Explain in 2–4 sentences what reported FCF now overstates and what you would look at in the cash flow statement to judge how much.

Graded on Explains how deferring maintenance affects current and future FCF · Names where on the cash flow statement the adjustment would be found

3Multiple choiceChecked instantly

Which statement best explains why free cash flow is a stronger measure of discretionary cash than operating cash flow alone?

  • AIt starts from net income, so it captures the company's true accrual earnings.
  • BIt adds depreciation back, making the available cash amount larger.
  • CIt includes every investing and financing cash flow, so it totals all cash movement.
  • DIt subtracts the cash reinvested in fixed assets, leaving cash after the asset base is sustained.

Lesson 26

Indirect method walkthrough

Shows how to derive operating cash flow by adjusting net income for non-cash items and changes in working capital.

20 min3 assessments

You have net income from the income statement, but that number includes non-cash items like depreciation and gains on asset sales. Cash hasn't moved for those. The indirect method starts with net income and adjusts it to show actual cash from operations. You'll work through three kinds of adjustments: non-cash expenses, gains/losses, and changes in working capital.

Steps
0/7

Follow these steps to convert net income into cash from operations. Use a real company's financial statements or the example below.

  1. Start with net income

    Take net income from the income statement. For example, if net income is $100,000, write that as the starting point.

    Make sure you use net income, not gross profit or EBIT.

    The number matches the bottom line of the income statement.

  2. Add back depreciation and amortization

    Find depreciation and amortization expense (usually on the income statement or in the notes). Add the total to net income. These are non-cash charges that reduced net income but didn't reduce cash.

    Don't add back impairment losses or write-downs unless they are clearly non-cash and not already included in depreciation.

    The running total increases by the depreciation amount.

  3. Adjust for gains and losses on asset sales

    If the company sold equipment or investments, the gain or loss is included in net income but the cash from the sale appears in investing activities. Subtract gains (because they inflated net income without operating cash) and add back losses (because they reduced net income without operating cash).

    Only adjust gains/losses from the sale of long-term assets, not from normal product sales.

    A gain reduces the running total; a loss increases it.

  4. Adjust for changes in accounts receivable

    Compare this year's accounts receivable to last year's. If receivables increased, that means you recorded sales on credit that haven't been collected yet — subtract the increase. If receivables decreased, add the decrease because cash was collected.

    Use the change in the balance sheet account, not the total. Increase = subtract; decrease = add.

    The running total moves opposite to the change in receivables.

  5. Adjust for changes in inventory

    If inventory increased, the company spent cash to buy more inventory than it sold — subtract the increase. If inventory decreased, add the decrease because cash was freed up.

    Don't confuse inventory with cost of goods sold. The adjustment is the change in the inventory balance.

    Inventory increase reduces cash; inventory decrease adds cash.

  6. Adjust for changes in accounts payable

    If accounts payable increased, the company delayed paying suppliers — that's a source of cash, so add the increase. If payables decreased, cash was used to pay down liabilities — subtract the decrease.

    Only include trade payables, not short-term debt or accrued expenses that are not operating.

    Payables increase adds cash; decrease subtracts cash.

  7. Adjust for other operating assets and liabilities

    Repeat the same logic for other current operating items: prepaid expenses, accrued liabilities, deferred revenue, etc. Add increases in liabilities and subtract increases in assets.

    Exclude items that are investing or financing, like dividends payable or notes payable.

    The total after all adjustments equals cash from operations.

Indirect method for GreenLeaf Inc.

Given:

  • Net income: $50,000
  • Depreciation expense: $8,000
  • Gain on sale of equipment: $2,000
  • Increase in accounts receivable: $3,000
  • Decrease in inventory: $1,500
  • Increase in accounts payable: $2,500

Calculation: | Step | Adjustment | Running Total | |------|------------|---------------| | Net income | — | $50,000 | | Add depreciation | +$8,000 | $58,000 | | Subtract gain on sale | -$2,000 | $56,000 | | Subtract AR increase | -$3,000 | $53,000 | | Add inventory decrease | +$1,500 | $54,500 | | Add AP increase | +$2,500 | $57,000 |

Result: Cash from operations = $57,000.

Checklist
0/7

Indirect method field checklist

Keep this checklist open while you work through a real cash flow statement.

Check yourself

Test your understanding of the indirect method steps.

1Put in orderChecked instantly

Arrange the following steps in the correct order for the indirect method of calculating cash from operations.

  • AAdd depreciation and amortization
  • BStart with net income
  • CAdjust for changes in accounts receivable, inventory, and accounts payable
  • DAdjust for gains or losses on asset sales
2Short answerMarked by AI

A company has net income of $120,000, depreciation of $15,000, a loss on sale of equipment of $3,000, an increase in accounts receivable of $8,000, a decrease in inventory of $4,000, and an increase in accounts payable of $6,000. Compute cash from operations using the indirect method. Show your work and state the final number.

Graded on Correctly starts with net income and adds non-cash expenses · Correctly adjusts for changes in working capital (AR, inventory, AP) · Final answer is numerically correct with work shown

3Short answerMarked by AI

Explain in 2-4 sentences why depreciation is added back to net income when using the indirect method. What would happen to cash from operations if you forgot to add it back?

Graded on Identifies depreciation as non-cash · Explains the effect of adding it back · Describes consequence of omitting the adjustment

Lesson 27

Cash conversion cycle

Explains the cycle from cash spent on inventory to cash collected from customers, and how it affects liquidity.

15 min3 assessments

You already know that operating cash flow adjusts net income for changes in working capital. The cash conversion cycle (CCC) puts a number on exactly how long cash is tied up in that process — from the day you pay for inventory to the day you collect cash from customers.

The formula is simple:

CCC = Days Inventory Outstanding (DIO) + Days Sales Outstanding (DSO) – Days Payable Outstanding (DPO)

  • DIO: how many days on average inventory sits before it is sold.
  • DSO: how many days on average it takes to collect payment after a sale.
  • DPO: how many days on average you delay paying your own suppliers.

A shorter cycle means cash moves faster — less capital is tied up, reducing the need for borrowing. A longer cycle signals potential trouble: inventory is piling up, customers are slow to pay, or you are paying suppliers too early. Some businesses even run negative CCC (e.g., collect cash before they must pay suppliers), which is a strong liquidity advantage.

You do not need to compute each ratio from scratch — they are often reported or easily derived from the balance sheet and income statement. The CCC ties the three working capital pieces together into one actionable number.

The cash conversion cycle from payment to collection

Analogy

Imagine you run a food truck. You buy supplies on Monday (cash out). You spend Tuesday prepping ingredients (that is your inventory period, DIO). On Wednesday you serve customers who pay with credit cards that settle in three days (that is your collection period, DSO). Meanwhile, your vegetable supplier lets you pay on Friday (your payables period, DPO). The number of days from Monday to Friday, minus any grace from the supplier, is your cash conversion cycle. The shorter that span, the less you need to dip into your personal savings to keep the truck running.

Where the analogy breaks down

A food truck's inventory is perishable and turns over in days, while a manufacturer may hold raw materials for months. The analogy also assumes all customers eventually pay, ignoring bad debts that can lengthen or break the cycle entirely.

  • Cash conversion cycle = DIO + DSO – DPO, measured in days.
  • DIO measures how long inventory is held before sale.
  • DSO measures how long it takes to collect cash from a sale.
  • DPO measures how long you delay paying suppliers.
  • A shorter cycle means less cash tied up in operations, improving liquidity.
  • A negative CCC means you collect cash before paying suppliers – a very strong liquidity position.
  • Comparing a company's CCC over time or against competitors reveals operational efficiency trends.

RetailCo's cash conversion cycle

RetailCo reports:

  • DIO = 45 days (inventory sits for 45 days on average)
  • DSO = 30 days (customers pay in 30 days)
  • DPO = 20 days (suppliers are paid in 20 days)

CCC = 45 + 30 – 20 = 55 days

Interpretation: RetailCo's cash is tied up for 55 days from the moment it pays for inventory until it receives cash from customers. If the industry average is 40 days, RetailCo is slower — it may be holding too much stock or giving generous payment terms to customers. A competitor with CCC of 30 days (by reducing DIO or extending DPO) would need less working capital and could reinvest cash sooner.

Common misconception

“A longer cash conversion cycle is better because it means the company is delaying payments to suppliers and using their money for free.”

Extending DPO does indeed keep cash in the business longer, which can temporarily improve cash flow. Some successful companies like Amazon have very long payables periods.

What is actually true

A longer cycle driven by growing inventory or receivables often signals problems: unsold stock, customers not paying, or weakening bargaining power with suppliers. A long cycle due solely to extreme DPO may harm supplier relationships and can backfire if suppliers demand faster payment. The ideal is to shorten the cycle by reducing DIO and DSO while negotiating reasonable DPO.

Check yourself

Check your understanding of the cash conversion cycle.

1Multiple choiceChecked instantly

If a company's DIO increases while DSO and DPO stay the same, what happens to its cash conversion cycle?

  • AIt decreases
  • BIt stays the same
  • CIt increases
  • DIt depends on the industry
2Short answerMarked by AI

Company A has DIO=30, DSO=20, DPO=25. Company B has DIO=40, DSO=15, DPO=30. Calculate each company's cash conversion cycle and state which company has a shorter cycle. Then name one operational reason why Company A might have a shorter cycle.

Graded on Correct calculation of both CCCs · Comparison and operational reason · Clarity and conciseness

3Short answerMarked by AI

A retail company's CCC increased from 30 days to 50 days over two years. Using the CCC components, list two possible causes for this increase and explain why each one could hurt the company's liquidity.

Graded on Identifies two plausible causes linked to DIO, DSO, or DPO · Explains impact on liquidity for each cause

Lesson 28

Investing and financing activities

Covers cash flows from buying/selling assets (investing) and from debt/equity transactions (financing).

15 min3 assessments
  • Investing activities track cash spent on long-term assets (PP&E, acquisitions, investments) and cash received from selling them.
  • Financing activities track cash from debt or equity sources (borrowing, issuing shares) and cash used to repay or return them (dividends, share buybacks, debt repayment).
  • A negative net investing cash flow is normal for a growing company that buys more assets than it sells.
  • A positive net financing cash flow means the company raised more capital than it returned; a negative one means it returned more than it raised.
  • The sum of operating, investing, and financing cash flows equals the net change in cash on the balance sheet.

Excerpt from NovaTech's 2024 Cash Flow Statement

code16 lines
NovaTech Inc. – Consolidated Statement of Cash Flows (partial)
Year ended December 31, 2024 (in $000s)

Cash flows from investing activities:
  Purchase of property, plant & equipment    (12,400)
  Acquisition of subsidiary, net of cash      (8,000)
  Proceeds from sale of equipment               1,500
  Purchase of marketable securities            (2,000)
  Net cash used in investing activities      (20,900)

Cash flows from financing activities:
  Proceeds from long-term borrowings            6,000
  Repayment of long-term debt                  (3,000)
  Issuance of common stock                      2,500
  Dividends paid                               (1,800)
  Net cash provided by financing activities     3,700

What to notice:

  • Investing is dominated by purchases (negative numbers). The only positive line is the sale of equipment – a one-off disposal.
  • Financing shows both inflows (borrowing, stock issuance) and outflows (debt repayment, dividends). The net is positive, meaning NovaTech raised more cash than it returned.
  • The investing section almost always starts with the biggest cash outflows first; the financing section mixes sources and uses.
Steps
0/7

When you open a cash flow statement, the investing and financing sections appear after operating. Follow these steps to read and verify them correctly.

  1. Locate the investing activities section

    Find the heading 'Cash flows from investing activities' (or similar). It is usually the second major section after operating activities.

    Some companies combine investing and financing in one section – check the headings carefully.

    The first line item should be a purchase or sale of long-term assets, not operating items like accounts receivable.

  2. Identify every cash outflow for long-term assets

    Scan for purchases of property, plant & equipment (PP&E), acquisitions of other businesses, and purchases of investments (stocks, bonds, intellectual property). These all reduce cash.

    Leases classified as finance leases appear here; operating leases do not. If you see 'right-of-use assets', check the note for classification.

    Total outflows should match the increase in gross fixed assets on the balance sheet (from the fixed asset note, not the carrying amount).

  3. Identify every cash inflow from selling assets

    Look for proceeds from sale of PP&E, sale of investments, or sale of a business unit. These increase cash.

    Gains on sales are already removed from net income in the operating section; do not double-count. The full proceeds belong here.

    The sum of outflows and inflows gives net investing cash flow. Compare it to the prior year – a big swing may signal a major acquisition or divestiture.

  4. Move to the financing activities section

    Find the heading 'Cash flows from financing activities' (or 'financing'). It appears after investing.

    If the statement uses the direct method, operating may be listed first but investing and financing sections are the same structure.

    The first line item is typically proceeds from debt or equity issuances.

  5. Identify debt-related cash flows

    Look for proceeds from borrowing (positive) and repayments of debt (negative). Also note any changes in short-term borrowings (commercial paper, lines of credit).

    Debt issuance costs are sometimes netted against proceeds – the cash flow statement should show the net amount. Check the notes if the numbers seem off.

    The net debt cash flow should approximately match the change in total debt on the balance sheet (adjust for non-cash items like convertible notes).

  6. Identify equity-related cash flows

    Look for issuance of common stock (positive), repurchase of stock (negative), and dividends paid (negative). Stock dividends (bonus shares) do not involve cash and are not here.

    Treasury stock transactions appear here; be careful not to confuse with operating cash flows from share-based compensation (which are non-cash and added back in operating).

    Dividends paid should match the amount declared during the period, not the amount expensed (which includes accruals).

  7. Verify the total financing cash flow

    Sum all inflows and outflows in financing. The net figure is added to net cash from operations and investing to reach the total change in cash.

    If the net financing cash flow is large and positive while the company is mature, that might be a red flag – it could mean the company cannot self-fund.

    The bottom line of the entire statement (total change in cash) should match the difference in cash and cash equivalents on the balance sheet from start to end of period.

Checklist
0/7

Checklist for Analyzing Investing & Financing Activities

Use this checklist while you read any cash flow statement. Tick each item as you verify it.

Check yourself

Test your ability to classify and order cash flow activities.

1Put in orderChecked instantly

Arrange the following steps in the correct order to analyze a company's investing activities from its cash flow statement.

  • AIdentify all cash outflows for purchases of PP&E, acquisitions, and investments.
  • BLocate the heading 'Cash flows from investing activities'.
  • CCalculate net investing cash flow by summing all inflows and outflows.
  • DIdentify all cash inflows from sales of assets or businesses.
2Short answerMarked by AI

A company borrows $50,000 from a bank. That same day, it uses $30,000 of that cash to buy a new delivery truck. How should each transaction appear on the cash flow statement? Explain exactly which section and line type (inflow/outflow) each belongs to, and why one is investing and the other is financing.

Graded on Correct classification of loan · Correct classification of truck purchase · Explanation of why they differ

3Short answerMarked by AI

Look at the following line from a cash flow statement: 'Proceeds from sale of building – $200,000'. The building had a book value of $150,000 and was sold for $200,000, generating a $50,000 gain. The gain was removed from net income in the operating section. Explain where the $200,000 appears on the statement and why it is not split between operating and investing.

Graded on Identifies correct section and amount · Explains gain treatment · Distinguishes between operating and investing nature

Lesson 29

Negative operating cash flow warning signs

Describes why negative operating cash flow is a red flag even if net income is positive, and what to investigate.

10 min3 assessments
Decide

You are reviewing the annual report of a mid-sized manufacturer. Net income is $2.1 million — a solid profit. But the cash flow statement shows operating cash flow of –$350,000. The CEO says 'no problem, we're profitable.' You need to decide what to investigate first.

What is the most likely starting point for your investigation?

Decision tree for diagnosing negative operating cash flow despite positive net income.

  • Negative operating cash flow with positive net income is a red flag, not a contradiction.
  • The most common cause is a build-up of accounts receivable (customers not paying).
  • A build-up of inventory also consumes cash even if the inventory is sellable.
  • A decrease in accounts payable (paying suppliers faster) reduces cash on hand.
  • One-time non-cash charges (e.g., impairment, depreciation) can inflate net income without affecting cash.
  • Rapid growth often causes negative operating cash flow because working capital needs increase faster than profits.
  • Always compare the change in each working capital line item to the change in revenue or COGS.
Common misconception

“If net income is positive, the company must be generating cash.”

Net income is commonly called 'profit' and profit implies you have more cash than you started with, especially for non-accountants.

What is actually true

Net income is an accrual concept that includes non-cash revenues and expenses (like credit sales and depreciation). Operating cash flow shows actual cash generated. A company can report a profit while burning cash if it sells on credit or builds inventory.

Checklist
0/6

Investigating Negative Operating Cash Flow

Use this checklist each time you see a company with positive net income but negative operating cash flow.

Check yourself

Test your ability to diagnose negative operating cash flow.

1Select all that applyChecked instantly

Which of the following are common causes of negative operating cash flow when net income is positive? (Select all that apply.)

  • AA large increase in accounts receivable
  • BA large increase in accounts payable
  • CA large increase in inventory
  • DA large one-time non-cash expense like depreciation
  • EA large one-time cash expense like a lawsuit settlement
  • FRapid growth in sales
2Put in orderChecked instantly

Arrange the following steps in the order you would perform them when investigating negative operating cash flow. Start with the first step.

  • ACalculate DSO and compare to prior periods
  • BCheck the change in accounts payable
  • CIdentify the symptom: net income positive, operating cash flow negative
  • DCompute the change in each working capital line item as a percentage of revenue
  • ELook for one-time non-cash items in the income statement footnotes
3Short answerMarked by AI

A company reports net income of $5 million and operating cash flow of –$1 million. Its accounts receivable increased by $1.5 million, inventory increased by $0.5 million, and accounts payable decreased by $0.3 million. No one-time items. Explain why operating cash flow is negative and which working capital change is the largest contributor. (2–4 sentences.)

Graded on Identifies the relationship between net income and working capital changes · Identifies the largest contributor with supporting evidence · Explains why the specific change (AR, inventory, AP) affects cash

Lesson 30

Profitability ratios

You will be able to calculate and interpret gross margin, operating margin, net margin, ROE and ROA from real statements. Covers the DuPont breakdown of ROE into margin, turnover and leverage. Prevents comparing ROE across companies with different capital structures without decomposing it.

35 min4 assessments

Two companies report the same net income, and one is thriving while the other is quietly failing. Net income on its own tells you nothing, because it ignores how much revenue produced it, how many assets were needed to make it, and how much of the owners' money was at stake.

Ratios solve that by cancelling out size. Divide a profit line by the sales that generated it and you get a number you can compare across a $5 million firm and a $5 billion one, and across this year and last. Last node you followed where the cash went; this node turns the income statement into numbers you can judge.

Five ratios form a ladder down the income statement:

  • Gross margin = (Revenue - COGS) / Revenue. The cents of each sales dollar left after paying for the product itself. Pricing power and production cost control land here.
  • Operating margin = Operating income (EBIT) / Revenue. What the core business keeps after operating costs, before interest and tax. This isolates how well the business runs, independent of how it is financed.
  • Net margin = Net income / Revenue. The final survivor after every cost, interest and tax.
  • ROA = Net income / Total assets. How hard the whole asset base worked, whoever funded it.
  • ROE = Net income / Shareholders' equity. What the owners earned on the money they put in.

The fifth is not independent of the other four. The DuPont identity locks them together:

ROE = Net margin × Asset turnover × Equity multiplier

Same ROE, opposite reasons: one firm earns a fat margin on thin leverage, the other squeezes a thin margin through heavy debt. Until you decompose it, ROE is a number you cannot safely compare. The worked example below runs all five ratios on one company and shows the identity holding exactly. The nodes that follow this one take each ratio apart one at a time — what moves it and what it means for a specific business. This session's job is getting the calculations right and seeing how the five interlock.

Northwind Manufacturing — year ended 31 December

Income statement$
Revenue5,000,000
Cost of goods sold(3,000,000)
Gross profit2,000,000
Operating expenses(1,100,000)
Operating income (EBIT)900,000
Interest expense(150,000)
Income before tax750,000
Income tax (25%)(187,500)
Net income562,500
Balance sheet (year-end)$
Total assets4,500,000
Shareholders' equity2,250,000

Calculate all five profitability ratios, then confirm your ROE with the DuPont identity.

  1. 1

    Gross margin = ($5,000,000 - $3,000,000) / $5,000,000 = $2,000,000 / $5,000,000 = 0.40 = 40.0%

    Gross margin keeps only the cost of the goods sold out of the picture. Every dollar of sales leaves 40 cents to cover operating costs, interest and tax before any profit appears.

1/6
Reference

The five profitability ratios

Gross margin

Formula
(Revenue - COGS) / Revenue
What it isolates
Profit left after paying for the product itself
A high value suggests
Pricing power or low input costs

Operating margin

Formula
Operating income (EBIT) / Revenue
What it isolates
Profit after production and operating costs, before interest and tax
A high value suggests
The core business runs efficiently

Net margin

Formula
Net income / Revenue
What it isolates
Profit after every cost, interest and tax
A high value suggests
Tight overall cost control

ROA

Formula
Net income / Total assets
What it isolates
How hard every dollar of assets earns
A high value suggests
Efficient use of assets, often a light-asset model

ROE

Formula
Net income / Shareholders' equity
What it isolates
The return on the owners' money
A high value suggests
Strong return for shareholders — but check the leverage behind it

Equity multiplier

Formula
Total assets / Shareholders' equity
What it isolates
How many dollars of assets sit on each dollar of equity
A high value suggests
More leverage — amplifies gains and losses

ROE is the only ratio here that is not safe to compare across companies on its own. The DuPont identity splits it into margin × turnover × leverage, and the same ROE can hide very different risk.

Try it

Every run assumes the same business: $1,000k of assets and a 25% operating margin, so operating profit is always 25% of revenue. Debt = assets − equity, and interest is paid on that debt.

First discovery: keep revenue at 300 and the interest rate at 6%. Drag equity from 950 down to 50 — ROE climbs the whole way. The assets and operating profit have not changed; the same profit is being earned on a smaller equity base. That amplification is financial leverage.

Second discovery: raise the interest rate to 15% and drag equity down again. Past a crossover around $500k of equity, ROE turns negative — the debt now costs more than the operating profit it leverages. Leverage boosts ROE only while the assets it buys earn more than the interest they cost. Find the exact equity level where the sign flips, then move revenue and watch the crossover move with it.

300 $k
400 $k
6.0 %

ROE

—

This browser cannot run the calculation (Web Workers are unavailable).

Check yourself

Four questions; a calculator is allowed. Round to one decimal where a question says so.

1Multiple choiceChecked instantly

A retailer's revenue grows 20% this year while its net income stays exactly flat. What happens to its net margin, and why?

  • AIt rises — more revenue always means a bigger margin.
  • BIt stays the same — net income did not move.
  • CIt falls — the same profit is spread over more revenue.
  • DIt cannot be determined without the balance sheet.
2Numeric answerChecked instantly

A coffee roaster sells $800,000 of beans in a year, and the beans it roasted cost $530,000. What is its gross margin in percent? Round to one decimal if needed.

3Numeric answerChecked instantly

A logistics firm has a net margin of 4%, an asset turnover of 1.5 and an equity multiplier of 2.0. Using the DuPont identity, what is its ROE in percent?

4Short answerMarked by AI

Company A and Company B both report an ROE of 15%. A reaches it with a net margin of 10% and an equity multiplier of 1.6; B with a net margin of 3% and an equity multiplier of 5.0 (asset turnover is similar for both). What does the DuPont breakdown tell you about how each company earns its ROE, and which one would you be more cautious about? Answer in 2–4 sentences.

Graded on Reads off each company's DuPont driver with its numbers · Names the riskier company and justifies it from the structure · Uses the DuPont identity as the frame of the comparison

Lesson 31

Gross margin and operating margin

Calculates gross margin (gross profit / revenue) and operating margin (EBIT / revenue) and interprets what they reveal about cost control.

15 min3 assessments

Every annual report lists revenue, cost of goods sold (COGS), and operating expenses. But those absolute numbers only matter when you compare them to revenue — that is the only way to see whether a business is in control of its costs as it grows.

Gross margin tells you how efficiently a company makes its product. Operating margin tells you how efficiently it runs the whole business.

Gross margin = (Revenue − COGS) ÷ Revenue, or what is left after paying for the raw materials, direct labour and factory costs directly tied to production. It is the money available to cover everything else: sales staff, rent, R&D, interest, taxes.

Operating margin = EBIT ÷ Revenue. EBIT (earnings before interest and tax) subtracts not only COGS but also all operating expenses: selling, general and administrative costs (SG&A), depreciation, amortisation and R&D. This is what the company’s core operations earn before the financial structure (debt) and tax regime muddy the picture.

Both are expressed as percentages. A gross margin above 50 % suggests pricing power or low input costs. A gross margin below 20 % signals either a commodity business or razor‑thin pricing. Operating margin below 5 % means the company’s overheads are eating almost everything the product earns.

You have the 2024 income statement of GreenGrid Energy (fictitious):

  • Revenue: €50,000,000
  • COGS: €31,500,000
  • SG&A: €9,200,000
  • Depreciation: €2,800,000
  • R&D: €1,500,000
  • Interest expense: €1,000,000
  • Tax: €2,000,000

Calculate gross margin and operating margin. Interpret what they say about the company’s cost control.

  1. 1

    Gross profit = Revenue − COGS €50,000,000 − €31,500,000 = €18,500,000

    COGS is the direct cost of producing the energy — fuel, turbine maintenance, grid connection fees.

1/4
Try it

Drag COGS up until gross margin drops below 20 %, then drag operating expenses up until operating margin turns negative. Notice how a healthy gross margin can hide a loss once overheads are added. The crossover point — where operating margin hits 0 — is your break‑even on operations.

500000 €
300000 €
120000 €

Margins

—

This browser cannot run the calculation (Web Workers are unavailable).

Go deeper

Read these articles for definitions, industry benchmarks and historical margin data. Use the tables to see what margins are typical in the sectors you analyse.

Check yourself

Check that you can calculate and interpret each margin.

1Numeric answerChecked instantly

A company has revenue of €8,000,000, COGS of €4,800,000, and operating expenses (including depreciation) of €2,400,000. What is its gross margin expressed as a percentage? Round to one decimal place.

2Numeric answerChecked instantly

Using the same company (revenue €8,000,000, COGS €4,800,000, operating expenses €2,400,000), what is its operating margin expressed as a percentage? Round to one decimal place.

3Short answerMarked by AI

You see two companies with the same revenue. Company A has a gross margin of 20 % and an operating margin of 15 %. Company B has a gross margin of 55 % and an operating margin of 6 %. Which company is better at controlling production costs? Which is better at controlling overheads? Explain the difference.

Graded on Identifies production cost control from gross margin · Identifies overhead control from operating margin gap · Uses margin terminology correctly

Lesson 32

Net margin and return on assets

Calculates net margin (net income / revenue) and return on assets (net income / total assets) and explains how they measure overall profitability and asset efficiency.

15 min3 assessments

Net margin and return on assets (ROA) are two ratios that tell you how much profit a company keeps from each dollar of revenue and how efficiently it uses its assets to generate that profit.

Net margin = Net income ÷ Revenue. It shows the percentage of revenue that becomes profit after all expenses — including taxes and interest. A 10% net margin means the company keeps $0.10 of every $1 of sales.

Return on assets = Net income ÷ Total assets. It measures how well the company uses everything it owns (buildings, equipment, inventory, cash) to produce profit. An ROA of 5% means it earns $0.05 for every $1 of assets.

Both ratios are expressed as percentages. A higher number is generally better, but you must compare against the company's own history or industry peers — what's good for a software company (high margin, low assets) is different from a manufacturer (low margin, high assets).

You are analyzing GreenLeaf Inc. From its annual report: Revenue = $50,000,000; Net income = $3,500,000; Total assets = $28,000,000. Calculate net margin and ROA, then interpret the two ratios together.

  1. 1

    Net margin = $3,500,000 / $50,000,000

    Divide net income by revenue. This gives the profit percentage per dollar of sales.

1/5
Try it

Move the sliders to see how ROA changes when you keep net margin constant but increase total assets. Notice that if net income is negative, both ratios turn negative — that means the company is unprofitable. Find the point where ROA equals net margin. What does that imply about asset turnover? (Hint: when ROA = net margin, Revenue/Assets = 1, so revenue equals total assets.)

50000000 $
3500000 $
28000000 $

Net margin (%) and ROA (%)

—

This browser cannot run the calculation (Web Workers are unavailable).

  • Net margin = Net income ÷ Revenue; it measures profit per dollar of sales after all expenses.
  • Return on assets (ROA) = Net income ÷ Total assets; it measures profit per dollar of assets owned.
  • Both are expressed as percentages and should be compared to industry averages or historical trends.
  • A high net margin with low ROA suggests the company is profitable but holds many assets inefficiently.
  • A low net margin with high ROA suggests thin margins compensated by rapid asset turnover — common in retail.
  • Negative net margin or ROA means the company lost money in that period.
Go deeper

For a deeper look at profit margin types and how net margin fits with gross and operating margins.

Check yourself

Check your understanding of net margin and ROA.

1Numeric answerChecked instantly

A company reports revenue of $12,000,000, net income of $960,000, and total assets of $8,000,000. What is its net margin? Express your answer as a percentage (e.g., 8.0).

2Short answerMarked by AI

Explain in 2-3 sentences what a ROA of 15% tells you about a company's asset efficiency. How would you interpret it if the company's net margin is 5%?

Graded on Correctly interprets ROA as profit per dollar of assets. · Connects ROA to net margin and asset turnover. · Clarity and conciseness.

3Multiple choiceChecked instantly

Which of the following best describes the relationship between net margin and ROA?

  • AROA equals net margin multiplied by asset turnover.
  • BNet margin is always higher than ROA.
  • CROA equals net margin divided by total assets.
  • DNet margin and ROA are independent of each other.

Lesson 33

Return on equity and DuPont decomposition

Calculates ROE (net income / shareholders' equity) and breaks it down into net margin, asset turnover, and financial leverage using the DuPont formula.

20 min2 assessments

Return on Equity (ROE) tells you how much profit a company generates for every dollar of shareholders' money. But ROE alone doesn't say how that return was achieved. The DuPont decomposition breaks ROE into three levers:

ROE = Net Margin × Asset Turnover × Financial Leverage

  • Net Margin = Net Income / Revenue — how much profit from each dollar of sales.
  • Asset Turnover = Revenue / Total Assets — how efficiently the company uses its assets to generate sales.
  • Financial Leverage = Total Assets / Shareholders' Equity — how much debt the company uses to fund its assets.

A high ROE can come from high margins, efficient asset use, heavy debt, or any combination. The decomposition helps you see which lever is driving the number — and whether that driver is sustainable.

TechGear Inc. reports the following (in $ millions):

ItemAmount
Revenue400
Net Income20
Total Assets500
Shareholders' Equity200

Calculate ROE using the DuPont decomposition.

  1. 1

    Net Margin = Net Income / Revenue = 20 / 400

    Divide net income by revenue to find the profit margin per dollar of sales.

1/8
Try it

Drag the sliders to see how each component changes ROE. Notice that a small change in net margin has the same proportional effect as a change in leverage. But leverage above 3.0 often signals high debt risk — can you find a combination that gives 20% ROE with low leverage? What happens to ROE if margin drops to 2% but leverage is pushed to 4.0?

5.0 %
0.8
2.5

ROE

—

This browser cannot run the calculation (Web Workers are unavailable).

  • ROE = Net Income / Shareholders' Equity — measures return on owners' investment.
  • DuPont decomposition: ROE = Net Margin × Asset Turnover × Financial Leverage.
  • Net margin shows profitability per dollar of sales.
  • Asset turnover shows sales generated per dollar of assets.
  • Financial leverage shows how much debt amplifies equity returns (and risk).
  • A high ROE from high leverage is riskier than one from high margin or turnover.
Go deeper

Read these articles for the historical background and alternative DuPont formulations (e.g., five-component version).

Check yourself

Check your understanding of ROE and DuPont decomposition.

1Numeric answerChecked instantly

A company reports: Net Income = $2 million, Shareholders' Equity = $10 million, Total Assets = $20 million, Revenue = $40 million. What is the ROE (as a percentage)?

2Short answerMarked by AI

Explain why a company with a high ROE might still be risky. Use the DuPont components in your answer.

Graded on Identifies leverage as a source of risk · Connects leverage to potential downside · Contrasts with other DuPont components

Lesson 34

Interpreting profitability ratios

Discusses how to compare ratios across time and against peers, and what a high or low ratio might indicate about the business.

10 min3 assessments
Decide

You're comparing two retailers in the same industry. Both have similar revenue and gross margins (~40%). But their net margins and ROE are very different:

MetricCompany ACompany B
Net margin15%5%
ROE8%18%

Something doesn't add up. A higher net margin should logically boost ROE – but Company B has triple the ROE despite a third of the net margin. What's going on?

Which company appears to be generating better returns for shareholders?

Decision tree for diagnosing profitability ratio mismatches

  • Profitability ratios must be interpreted together: net margin, ROE, ROA, asset turnover and leverage form the DuPont system.
  • A high net margin with a low ROE usually signals low financial leverage or low asset turnover.
  • A low net margin with a high ROE usually signals high leverage (high equity multiplier).
  • Compare ratios across time (trends) and against industry peers to separate company-specific factors from market conditions.
  • Always check the equity multiplier when ROE diverges from net margin – that's where the leverage story lives.
  • Asset turnover bridges profitability and efficiency: two companies with the same net margin can have very different ROEs if turnover differs.
Common misconception

“A company with a high net margin is always a more profitable investment than one with a lower net margin.”

Net margin is the most widely quoted profitability ratio – it's easy to see a 15% net margin and assume the company is 'more profitable' in every sense.

What is actually true

Profitability for shareholders is measured by ROE, which is net margin times asset turnover times leverage. A company can have a lower net margin but higher ROE if it uses debt effectively (e.g., 5% net margin × 2 turnover × 3 leverage = 30% ROE). True profitability includes how efficiently the company uses its assets and debt, not just its margins.

Check yourself

Test your ability to diagnose profitability ratios.

1Put in orderChecked instantly

Put the steps for diagnosing a company with high net margin but low ROE in the correct order.

  • ACheck the company's equity multiplier (leverage)
  • BCompare net margin and ROE – identify the mismatch
  • CIf equity multiplier is low, conclude low leverage depresses ROE
  • DIf equity multiplier is high but ROE still low, check asset turnover
2Select all that applyChecked instantly

Which of the following could explain a low ROE despite a high net margin? (Select all that apply.)

  • ALow asset turnover (inefficient use of assets)
  • BHigh financial leverage
  • CLarge equity base (low equity multiplier)
  • DHigh gross margin but high operating expenses
  • EVery low debt
3Short answerMarked by AI

Company X has net margin 10%, asset turnover 0.8, and equity multiplier 1.2. Company Y has net margin 4%, asset turnover 1.5, and equity multiplier 4.0. Both have $100 million in revenue. Calculate each company's ROE and explain which you'd consider 'better' from a profitability perspective and why.

Graded on Calculates both ROEs correctly · Explains the role of leverage in the difference · Justifies which company is 'better' with reasoning

Lesson 35

Liquidity and solvency ratios

You will be able to calculate the current ratio, quick ratio, debt-to-equity and interest cover and say what each one warns about. Covers the difference between a liquidity crisis and insolvency, and the limits of the current ratio. Prevents the error of treating all debt as bad without asking what it is funding.

30 min4 assessments

You can already tell whether a company is profitable — gross margin, ROE, the whole DuPont breakdown. Profitability says nothing about survival. A business that turns a profit can still run out of cash when its customers pay late and its suppliers demand cash today; that is a liquidity crisis. A business whose total debts exceed its total assets is insolvent — it owes more than it owns, and no amount of waiting fixes that.

This node gives you four ratios that separate the two problems. You calculate each one from a real income statement and balance sheet and decide what the number means — and, more important, what it does not tell you. The next three nodes will sharpen each ratio individually and cover the traps, but here you see them all together.

You are given these extracts from a company's annual report. Calculate the current ratio, quick ratio, debt-to-equity ratio and interest cover.

Balance sheet (extract) | Item | Amount ($'000) | |------|------| | Current assets | 450 | | Inventory | 130 | | Current liabilities | 225 | | Total debt | 800 | | Shareholders' equity | 500 |

Income statement (extract) | Item | Amount ($'000) | |------|------| | EBIT | 240 | | Interest expense | 60 |

  1. 1

    Current ratio = Current assets / Current liabilities = 450 / 225

    Current ratio measures whether short-term assets cover short-term obligations. A ratio above 1.0 means they do, but the adequacy depends on the industry.

1/8
Try it

Drag the sliders to discover the threshold where the current ratio falls below 1.0. What happens to the ratio when current liabilities exceed current assets? A ratio below 1.0 means the company cannot cover its short-term obligations with its short-term assets alone — a red flag for liquidity.

200 $'000
100 $'000

Current ratio

—

This browser cannot run the calculation (Web Workers are unavailable).

  • The current ratio (current assets / current liabilities) tests whether short-term assets are enough to pay short-term debts; a ratio below 1.0 signals a liquidity problem.
  • The quick ratio (current assets minus inventory over current liabilities) is a stricter test because inventory is the least liquid current asset.
  • Debt-to-equity (total debt / shareholders' equity) measures financial leverage; a higher ratio means more risk but also more potential return on equity.
  • Interest cover (EBIT / interest expense) shows how easily a company can pay its interest; a cover below 1.5 means it is at risk of defaulting on debt.
  • A liquidity crisis is a temporary cash shortfall; insolvency is when liabilities permanently exceed assets — the two are different problems that require different fixes.
Check yourself

Test your understanding of liquidity and solvency ratios.

1Multiple choiceChecked instantly

What does the current ratio primarily measure?

  • AProfitability relative to sales
  • BThe ability to pay short-term obligations with short-term assets
  • CThe proportion of debt financing in the capital structure
  • DHow many times interest expense is covered by operating profit
2Numeric answerChecked instantly

A company has current assets of $600,000 and current liabilities of $300,000. What is its current ratio?

3Numeric answerChecked instantly

A company has total debt of $1,200,000 and shareholders' equity of $800,000. What is its debt-to-equity ratio?

4Short answerMarked by AI

A company has a debt-to-equity ratio of 4.0. What does this suggest about the company's financial risk and capital structure? What additional information would you want before deciding whether this is a problem?

Graded on Identifies the level of financial leverage · Describes the associated risk · Requests additional context

Lesson 36

Current ratio and quick ratio

Calculates current ratio (current assets / current liabilities) and quick ratio (quick assets / current liabilities) and explains what they measure about short-term liquidity.

15 min2 assessments

A liquidity ratio answers one urgent question: If everything went wrong tomorrow, could you pay the bills due this year?

Last node taught you that liquidity is about the timing of cash — not whether you are profitable overall. Now you need the two numbers that lenders, suppliers and investors check first: the current ratio and the quick ratio.

Both compare what you own that will turn into cash soon (current assets) against what you owe that is due soon (current liabilities). The quick ratio is stricter: it removes inventory, because unsold stock might take months to turn into cash, and you cannot pay a supplier with a pallet of goods.

Neither ratio tells the whole story — they are screens, not diagnoses. A ratio well above 2 does not guarantee safety, and one below 1 is not always fatal. But when you find an outlier, you know exactly which line items to interrogate.

Reference

Liquidity ratio formulas at a glance

Current ratio

Formula
Current assets ÷ Current liabilities
What it measures
Short-term solvency — can all near-term obligations be met with near-term resources?
Rule of thumb
1.5–2.0 is comfortable; < 1.0 is a red flag

Quick ratio (acid test)

Formula
(Current assets − Inventory − Prepaids) ÷ Current liabilities
What it measures
SAME as above, but only counting assets that can be liquidated fast — no inventory dependency
Rule of thumb
1.0 is adequate; < 0.5 is serious concern

Both ratios use the same balance sheet snapshot. The difference lies entirely in what counts as a 'current asset'.

Greenfield Hardware reports these current-period figures from its balance sheet:

ItemAmount
Cash£12,000
Accounts receivable£8,000
Inventory£15,000
Prepaid insurance£500
Accounts payable£14,000
Short-term notes payable£6,000
Accrued expenses£2,000

Calculate the current ratio and the quick ratio. Interpret each.

  1. 1

    Current assets = 12,000 + 8,000 + 15,000 + 500 = 35,500

    Add every asset expected to turn into cash or be used up within one year: cash, receivables, inventory and prepaids.

1/5
Try it

Fix liabilities at £80,000. Start with cash+receivables at £40,000 and inventory at £0. Now drag inventory up to £80,000 — watch the current ratio climb while the quick ratio stays flat. The gap between the two ratios is inventory's "masking effect": an inventory-heavy company can look liquid on the current ratio alone. Find the point where the quick ratio crosses 1.0 by dragging cash+receivables only.

50000 £
30000 £
60000 £

Current ratio | Quick ratio | Gap

—

This browser cannot run the calculation (Web Workers are unavailable).

Common misconception

“"A high current ratio — 3.0 or higher — always means the company is very safe."”

The more current assets you have relative to current liabilities, the more cushion you appear to have. It feels like the safety margin scales linearly.

What is actually true

A current ratio above 2.5 often signals inefficient use of assets — too much cash sitting idle, too many receivables not collected, or bloated inventory that may be obsolete. Cash tied up in current assets earns nothing. Investors typically prefer a ratio near 1.5–2.0, which balances safety with efficiency.

  • Current ratio = current assets ÷ current liabilities; quick ratio = (current assets − inventory − prepaids) ÷ current liabilities.
  • The quick ratio is always less than or equal to the current ratio because it excludes slower-to-liquidate assets.
  • A current ratio below 1.0 means current liabilities exceed current assets — a classic liquidity warning.
  • A quick ratio below 1.0 is common in retailers with fast inventory turnover and is not necessarily dangerous.
  • Both ratios are snapshot measures from the balance sheet date; a single outlier could be seasonal or transactional.
  • The gap between the two ratios measures how much the company depends on inventory sales to stay liquid.
Check yourself
1Numeric answerChecked instantly

A company has current assets of £240,000, inventory of £80,000, and current liabilities of £150,000. What is its quick ratio? Round to two decimal places.

Graded on Placeholder · Placeholder 2

2Short answerMarked by AI

Greenfield Hardware's quick ratio is 0.91. The industry average for hardware retailers is 0.85. Is Greenfield's liquidity situation clearly safe, clearly risky, or does the answer depend on something else? Explain in 2–4 sentences.

Graded on Identifies the ambiguity beyond a single ratio · Interprets the numerical distance from 1.0 and the industry benchmark · Draws a concrete business consequence

Lesson 37

Debt-to-equity and interest cover

Calculates debt-to-equity (total debt / shareholders' equity) and interest cover (EBIT / interest expense) and explains their role in assessing solvency.

15 min2 assessments

You already know that debt-to-equity (D/E) and interest cover measure solvency — whether a company can survive over the long term. Now you'll calculate them from real numbers and decide what they mean.

Debt-to-equity compares what the company owes (total debt) to what the owners have put in (shareholders' equity). A D/E above 1.0 means debt exceeds equity — the company is funded more by borrowing than by owners. Above 2.0 often signals distress, though the threshold varies by industry.

Interest cover (times interest earned) compares operating profit (EBIT) to interest expense. It answers: "How many times can the company pay its interest from earnings?" A cover below 1.5 is a red flag; below 1.0 means earnings can't cover interest — insolvency is near.

Both ratios come from the balance sheet and income statement. You'll use the same source document to get both.

GreenTech Ltd

Balance sheet (extract):

  • Total debt (short-term + long-term): $500,000
  • Shareholders' equity: $1,200,000

Income statement (extract):

  • EBIT (Earnings Before Interest and Tax): $350,000
  • Interest expense: $80,000

Calculate the debt-to-equity ratio and interest cover. Interpret each.

  1. 1

    Debt-to-equity = Total debt / Shareholders' equity = $500,000 / $1,200,000

    Total debt includes all interest-bearing liabilities (bank loans, bonds, lease obligations). Equity is the book value of common stock plus retained earnings. The ratio compares the two.

1/5
Try it

Drag the sliders to see how debt and equity affect the ratio. Find the debt level that pushes D/E above 1.0 — that's the point where debt equals equity. What happens if you keep debt at $500,000 but reduce equity to $250,000? Notice that a small drop in equity can dramatically increase the ratio. This is why companies with thin equity bases are risky: a small loss can wipe out equity and send D/E soaring.

500000 $
1200000 $

Debt-to-equity ratio

—

This browser cannot run the calculation (Web Workers are unavailable).

  • Debt-to-equity = total debt ÷ shareholders' equity. A ratio above 1.0 means debt exceeds equity.
  • Interest cover = EBIT ÷ interest expense. A cover below 1.5 signals danger; below 1.0 means earnings can't pay interest.
  • Both ratios use data from the balance sheet (debt, equity) and income statement (EBIT, interest).
  • A low D/E does not automatically mean safety — if interest cover is also low, the company may still struggle to service debt.
  • Industry norms matter: capital-intensive industries (utilities, telecoms) often have higher D/E than service firms.
Check yourself

Check your ability to calculate and interpret these ratios.

1Numeric answerChecked instantly

A company reports EBIT of $620,000 and interest expense of $145,000. What is its interest cover? Round to one decimal place.

2Short answerMarked by AI

A retail chain has a debt-to-equity ratio of 2.8 and interest cover of 1.2. In two to four sentences, explain whether this company is solvent and what risks it faces.

Graded on Identifies solvency status with justification from D/E · Interprets interest cover and its implication · Connects both ratios to overall risk

Lesson 38

Liquidity crisis vs insolvency

Distinguishes between a temporary cash shortfall (liquidity crisis) and a situation where liabilities exceed assets (insolvency).

10 min3 assessments

A company that can't pay its bills this month might be in trouble—but is it a temporary cash shortfall or a sign that the business is fundamentally broken? The difference between a liquidity crisis and insolvency determines whether the fix is a short-term loan or a full restructuring. Confusing them leads to the wrong action: lending to a company that can't be saved, or forcing a healthy one into bankruptcy.

You already know how to calculate liquidity and solvency ratios. Now you need to read the story they tell together. A low current ratio alone doesn't mean insolvency; a high debt-to-equity ratio alone doesn't mean a liquidity crisis. The key is whether the company's assets still exceed its liabilities and whether the cash shortage is a timing issue or a structural one.

The table below shows the axes that actually separate a liquidity crisis from insolvency. Use it when you look at a set of financial statements and need to decide what kind of trouble the company is in.

Liquidity crisis

Cause
Timing mismatch between cash inflows and outflows (e.g., seasonal sales, delayed receivables)
Balance sheet sign
Current ratio < 1, quick ratio < 1, but total assets > total liabilities (positive equity)
Timeframe
Short-term (days to months); the company is profitable and solvent
Typical fix
Short-term loan, invoice factoring, or negotiating payment terms
Impact on creditors
Creditors may be paid late but are eventually paid in full; no loss of principal

Best for A profitable company with a temporary cash gap that can be covered by borrowing or accelerating receivables.

Insolvency

Cause
Liabilities exceed assets (negative equity), often due to sustained losses or asset impairment
Balance sheet sign
Total liabilities > total assets (negative shareholders' equity); debt-to-equity ratio > 1 and rising
Timeframe
Long-term (months to years); the company is unprofitable and cannot recover without restructuring
Typical fix
Debt restructuring, asset sales, equity injection, or bankruptcy proceedings
Impact on creditors
Creditors face partial or total loss of principal; may need to write down debt

Best for A company whose liabilities exceed its assets and whose operations cannot generate enough profit to restore solvency without a fundamental change.

Two companies, two problems

Company A – Seasonal Retailer

  • Current assets: $200,000; Current liabilities: $250,000 → Current ratio = 0.8
  • Quick assets: $180,000 → Quick ratio = 0.72
  • Total assets: $500,000; Total liabilities: $300,000 → Equity = $200,000 (positive)
  • Net income last year: $80,000
  • Cash flow: negative in Q1 due to inventory build-up, positive in Q4

Company B – Struggling Manufacturer

  • Current assets: $150,000; Current liabilities: $100,000 → Current ratio = 1.5
  • Quick assets: $120,000 → Quick ratio = 1.2
  • Total assets: $400,000; Total liabilities: $600,000 → Equity = -$200,000 (negative)
  • Net income last year: -$50,000 (loss)
  • Cash flow: consistently negative for three years

Analysis Company A has a liquidity crisis: it can't pay its current bills right now, but it has positive net worth and is profitable. A short-term line of credit would bridge the gap until holiday sales arrive. Company B is insolvent: its liabilities exceed its assets, it's losing money, and no amount of short-term borrowing will fix the underlying problem. The fix requires restructuring debt or an equity injection.

Common misconception

“If a company can't pay its debts, it's insolvent.”

Inability to pay is a clear sign of financial distress, and insolvency is the legal term for being unable to pay debts as they come due.

What is actually true

Inability to pay can be due to a temporary liquidity crisis even when the company is solvent (assets > liabilities). The legal definition of insolvency has two forms: 'cash-flow insolvency' (can't pay debts when due) and 'balance-sheet insolvency' (liabilities exceed assets). A liquidity crisis is cash-flow insolvency without balance-sheet insolvency. The critical distinction is whether the company has positive net worth and a path to generate cash.

Decide

You are a credit analyst reviewing two companies. Use the ratios and context to decide which problem each faces.

Company X

  • Current ratio: 0.6, Quick ratio: 0.5
  • Debt-to-equity: 0.4
  • Net income: positive for the last three years
  • Order backlog: strong, but customers pay on net-60 terms
  • Cash flow: negative this month due to a large inventory purchase

Company Y

  • Current ratio: 1.2, Quick ratio: 0.9
  • Debt-to-equity: 4.0
  • Shareholders' equity: -$1 million (negative)
  • Net income: negative for two years
  • Cash flow: consistently negative, and the company has sold assets to pay bills

Which company is experiencing a liquidity crisis, and which is insolvent?

Check yourself

Check your understanding of the distinction between a liquidity crisis and insolvency.

1Multiple choiceChecked instantly

Which of the following is a definitive sign of insolvency rather than a liquidity crisis?

  • ACurrent ratio below 1.0
  • BNegative shareholders' equity
  • CLow quick ratio
  • DHigh inventory turnover
2Select all that applyChecked instantly

Select all statements that are true about the difference between a liquidity crisis and insolvency. (More than one is correct.)

  • AA liquidity crisis can often be solved by a short-term loan.
  • BInsolvency means total liabilities exceed total assets.
  • CA company with a liquidity crisis is always unprofitable.
  • DAn insolvent company may still have positive cash flow from operations.
  • EA liquidity crisis always leads to insolvency if not addressed.
3Short answerMarked by AI

Explain why a company with a current ratio of 0.7 might still be solvent, and what additional information you would need to confirm it is a liquidity crisis rather than insolvency.

Graded on Identifies solvency condition · Suggests additional information · Explains liquidity crisis

Lesson 39

Limits of ratio analysis

Discusses pitfalls such as window dressing, industry differences, and the need to look beyond a single ratio.

10 min3 assessments
Decide

You are analyzing a company called GreenLeaf Supplies. The latest annual report shows a current ratio of 2.5 (industry average 1.5) and a quick ratio of 0.8 (industry average 1.0). Despite these numbers, the company is struggling to pay its suppliers on time. You suspect something is wrong with the ratios.

What is the most likely explanation for the contradiction between a high current ratio and a low quick ratio?

Decision tree for diagnosing the cause of a mismatch between current ratio and quick ratio.

Common misconception

“Ratios provide an objective and complete picture of a company's financial health.”

Ratios are calculated from audited financial statements, so they must be accurate and reliable indicators.

What is actually true

Ratios are only as good as the underlying data, and they can be manipulated through timing or accounting choices. They must be interpreted in context of industry, seasonality, and one-time events. A single ratio never tells the full story.

  • Ratios can be distorted by window dressing, where companies temporarily improve ratios before reporting.
  • Industry averages are essential for meaningful comparison; a ratio that looks good in one industry may be poor in another.
  • A single ratio never tells the full story; always look at a combination of ratios and trends over time.
  • Non-recurring items (e.g., asset sales, restructuring costs) can skew ratios and should be adjusted for.
  • Accounting policies (e.g., inventory valuation method, depreciation method) affect ratios and must be considered.
  • Ratios are backward-looking and may not predict future problems; always supplement with cash flow analysis.
Check yourself

Check your understanding of the limits of ratio analysis.

1Select all that applyChecked instantly

A company has a current ratio of 2.0 and a quick ratio of 0.5. Which of the following are possible explanations? (Select all that apply.)

  • AThe company has a large amount of inventory that is slow-moving.
  • BThe company has a large amount of prepaid expenses.
  • CThe company has a high proportion of cash and cash equivalents.
  • DThe company has recently sold a large amount of inventory on credit.
  • EThe company uses a different depreciation method than its peers.
  • FThe company's accounts receivable are mostly due within 30 days.
2Short answerMarked by AI

A retail company reports a current ratio of 1.8 and a quick ratio of 0.3. The industry average current ratio is 1.6 and quick ratio is 0.5. The company's inventory turnover is very high. Write a short analysis (2-3 sentences) explaining what you think is happening and what additional information you would request.

Graded on Identifies the likely cause (high inventory, low quick ratio, but high turnover suggests inventory is liquid) · Requests at least one specific additional data point

3Put in orderChecked instantly

Place the following steps in the correct order to investigate a potential window dressing in a company's financial statements.

  • ACalculate current and quick ratios for the past several quarters.
  • BCompare the current ratio to industry average.
  • CLook for a large increase in current assets just before the reporting date.
  • DCheck if the company sold inventory on credit near the reporting date.
  • EReview notes to financial statements for related party transactions.

Lesson 40

Efficiency ratios

You will be able to compute inventory turnover, receivables days and asset turnover and explain how they reveal the speed of the business. Covers the cash conversion cycle end to end. Prevents the mistake of looking at profitability alone when a company is tying up cash in slow-moving inventory.

25 min3 assessments

Efficiency ratios measure how quickly a company turns its resources into cash. Unlike liquidity ratios (which check whether you can pay short-term bills) or solvency ratios (which check long-term viability), efficiency ratios reveal the speed of operations. A business can be profitable yet still fail if it ties up cash in slow-moving inventory or waits too long for customers to pay.

The three key ratios are:

  • Inventory turnover: how many times per year a company sells and replaces its stock.
  • Receivables turnover: how many times per year it collects payments from customers.
  • Asset turnover: how much revenue each dollar of assets generates.

The cash conversion cycle (CCC) bundles the first two together with payables days – how long the company takes to pay its own suppliers – to answer one question: how many days elapse between paying for inventory and collecting cash from the sale?

A shorter CCC means less cash is tied up, which frees money for growth or debt reduction. A rising CCC is an early warning that operations are getting slower.

Compute the cash conversion cycle and asset turnover for AlphaMart using the following annual figures: Revenue = $2,000,000; Cost of Goods Sold = $1,200,000; Average Inventory = $200,000; Average Accounts Receivable = $160,000; Average Accounts Payable = $100,000; Total Assets = $1,000,000.

  1. 1

    Inventory turnover = COGS / Average Inventory = $1,200,000 / $200,000 = 6.0 times

    This tells us AlphaMart sells and replaces its entire inventory 6 times per year.

1/8
Try it

Drag the sliders to see how each component affects the cash conversion cycle. Pay special attention when the CCC becomes negative – does that mean the business is 'super-efficient'? Consider what happens when you push payables days very high: you may gain cash but risk harming supplier trust.

60 days
30 days
30 days

Cash Conversion Cycle

—

This browser cannot run the calculation (Web Workers are unavailable).

  • Efficiency ratios measure how quickly a company turns resources into cash – speed matters alongside profitability.
  • The cash conversion cycle (CCC) = inventory days + receivables days – payables days.
  • Asset turnover = revenue ÷ total assets; a higher number means assets are used more intensively.
  • A rising CCC is a warning sign that cash is getting trapped in operations.
  • A negative CCC means a company collects cash before paying suppliers – a sign of strong bargaining power, but not always sustainable.
Check yourself

Check your understanding of efficiency ratios.

1Numeric answerChecked instantly

AlphaMart’s balance sheet shows average inventory of $150,000 and COGS of $900,000. What is the inventory turnover? Express your answer as a number (e.g., 8.0).

2Numeric answerChecked instantly

Using the inventory turnover from above, what are the inventory days? Use 365 days per year. Round to one decimal.

3Short answerMarked by AI

A company has a cash conversion cycle of 45 days. Its main competitor’s CCC is 30 days. Identify two possible reasons for the difference and explain which one might indicate a problem rather than efficiency.

Graded on Identifies two plausible reasons related to the CCC components. · Analyzes which reason signals a problem and why.

Lesson 41

Inventory turnover

Measures how many times inventory is sold and replaced in a period; a low or falling number signals slow-moving stock.

12 min3 assessments

Inventory turnover tells you how efficiently a company converts its stock into sales. The formula is simple:

Inventory Turnover = Cost of Goods Sold (COGS) ÷ Average Inventory

Average inventory is (Beginning Inventory + Ending Inventory) ÷ 2. A turnover of 5 means the company sold and restocked its inventory five times in a year.

What does it mean?

  • High turnover (e.g., 15): products sell fast, capital isn’t tied up. But too high could mean frequent stockouts and lost sales.
  • Low turnover (e.g., 2): stock moves slowly, which ties up cash and increases storage costs. It may signal obsolete inventory.

Days Inventory Outstanding (DIO) converts the ratio into days: DIO = 365 ÷ Inventory Turnover

A DIO of 73 days means, on average, inventory sits 73 days before being sold.

This ratio is most useful when compared with the company’s own history or industry peers – a grocer will have much higher turnover than a luxury car dealer.

Company B reports:

  • COGS: $600,000
  • Beginning inventory: $90,000
  • Ending inventory: $110,000

Calculate inventory turnover and DIO. Then interpret the result.

  1. 1

    Average Inventory = (90,000 + 110,000) ÷ 2 = 100,000

    Add the two inventory balances and divide by 2 to get the average stock held during the year.

1/3
  • Inventory turnover = COGS ÷ average inventory.
  • Average inventory = (beginning + ending) ÷ 2.
  • A high turnover indicates fast-moving stock; a low turnover suggests slow-moving or obsolete inventory.
  • Days Inventory Outstanding (DIO) = 365 ÷ inventory turnover.
  • Compare turnover to historical trends or industry averages – no single 'good' number fits all businesses.
  • A very high turnover may signal risk of stockouts; a very low turnover ties up cash and increases carrying costs.
Try it

Move the sliders and watch the turnover change. Try increasing ending inventory while keeping COGS fixed – what happens? Why? A very high turnover (e.g., 20+) might mean the company is running lean and risks stockouts. A very low turnover (e.g., 1) may indicate products aren't selling. Can you find a balance that gives a DIO of about 60 days?

500000 $
80000 $
120000 $

Inventory Turnover

—

This browser cannot run the calculation (Web Workers are unavailable).

Check yourself

Now apply what you've learned.

1Numeric answerChecked instantly

If COGS is $300,000 and average inventory is $50,000, what is the inventory turnover? Enter your answer as a number (e.g., 6).

2Short answerMarked by AI

Company X has an inventory turnover of 2. Company Y in the same industry has a turnover of 10. What factors might explain the difference? Which company is riskier and why? Write 2–4 sentences.

Graded on Identifies plausible factors (e.g., product type, sales volume, pricing strategy, inventory management). · Evaluates risk for both companies, acknowledging that each can be risky in different ways.

3Numeric answerChecked instantly

If inventory turnover is 8, how many days does inventory sit on average? Use 365 days and round to the nearest whole number. Enter just the number of days.

Go deeper

For a deeper dive into inventory turnover calculations and variations such as using average inventory over several months, see the Wikipedia article.

Lesson 42

Receivables days

Shows how long customers take to pay; rising days mean cash is getting stuck in sales made on credit.

10 min3 assessments

Receivables days (also called days sales outstanding) measures how quickly customers pay their invoices. It tells you the average number of days between making a credit sale and collecting the cash. A lower number is better — cash comes in faster. A rising number means customers are taking longer to pay, which can strain your working capital.

You already know that efficiency ratios reveal how fast a business turns its assets into cash. Receivables days is the piece that focuses on the cash tied up in unpaid invoices. The formula is:

Receivables Days = (Average Accounts Receivable / Annual Credit Sales) × 365

  • Average Accounts Receivable is the average of the opening and closing balances of receivables on the balance sheet.
  • Annual Credit Sales is the total sales made on credit during the year (not cash sales). If the company only reports total sales, you may need to estimate credit sales from the income statement notes.

The result is a number of days. Compare it to the company's payment terms (e.g., "net 30"). If receivables days is 45 and terms are 30, customers are paying 15 days late on average.

Compute receivables days for a company with the following figures from its latest annual report:

  • Average accounts receivable: $50,000
  • Annual credit sales: $600,000
  1. 1

    Receivables Days = (Average Accounts Receivable / Annual Credit Sales) × 365

    Write down the formula. Make sure you use credit sales, not total sales.

1/4
Try it

Drag the sliders to see how receivables days change. Notice that doubling the average receivables doubles the days, while doubling the credit sales halves them. Try to find a combination that pushes days above 60 — that's a warning zone where cash is getting stuck for two months or more.

50000 $
600000 $

Receivables Days

—

This browser cannot run the calculation (Web Workers are unavailable).

  • Receivables days = (Average Accounts Receivable / Annual Credit Sales) × 365.
  • It measures the average time between a credit sale and cash collection.
  • A lower number is better — cash is collected faster, improving liquidity.
  • A sudden increase may signal slow-paying customers, looser credit terms, or collection difficulties.
  • Always compare receivables days to the company's stated payment terms (e.g., net 30).
  • Industry benchmarks vary: retail often runs 30 days, heavy equipment may run 90 days.
Check yourself

Test your understanding of receivables days.

1Multiple choiceChecked instantly

Which formula correctly calculates receivables days?

  • A(Average Receivables / Credit Sales) × 365
  • B(Credit Sales / Average Receivables) × 365
  • C(Average Receivables / Total Assets) × 365
  • D(Net Income / Average Receivables) × 365
2Numeric answerChecked instantly

A company has average accounts receivable of $75,000 and annual credit sales of $900,000. What are the receivables days? Round to one decimal place.

3Short answerMarked by AI

Explain why a sudden increase in receivables days from 30 to 60 might be a warning sign. What could be causing it?

Graded on Identifies cash flow impact · Lists plausible causes

Lesson 43

Payables days

Shows how long the company takes to pay suppliers; longer days can be a sign of bargaining power or of cash strain.

10 min3 assessments

You've seen how quickly a company collects cash from customers and sells its inventory. Now flip the lens: how long does the company delay paying its own suppliers?

Payables days answers that. It's the average number of days between buying goods on credit and actually sending the money. A longer number can mean the company has bargaining power — it can lean on suppliers. Or it can mean the company is short on cash and stalling. The ratio alone doesn't tell you which; you need context.

The formula is straightforward:

Payables Days = (Average Accounts Payable ÷ Cost of Goods Sold) × 365

  • Average Accounts Payable = (opening payables + closing payables) ÷ 2
  • Cost of Goods Sold (COGS) is what the company spent to make or buy what it sold. If COGS isn't broken out (some retailers show "cost of sales"), use that.

A few rules of thumb:

  • 30–45 days is typical for many industries.
  • Over 90 days often signals cash strain — or exceptionally strong negotiating power.
  • A sudden jump of 20+ days from one year to the next is a red flag.

Compute payables days for GreenLeaf Supplies for the year ended 31 December 2024.

Extracts from the financial statements:

  • Accounts payable, 1 Jan 2024: £42,000
  • Accounts payable, 31 Dec 2024: £58,000
  • Cost of goods sold for 2024: £520,000
  1. 1

    Average payables = (42,000 + 58,000) ÷ 2

    Add the opening and closing payables balances, then divide by 2.

1/4
Try it

Move the sliders to see what pushes payables days above 90 — a common threshold where analysts start asking whether the company is struggling to pay. Notice that a small increase in closing payables (while COGS stays flat) has a bigger effect than the same increase in opening payables, because the average is weighted equally but the closing balance is the one that carries forward into next year. Try setting opening payables to £50,000 and closing payables to £120,000 with COGS at £400,000 — what happens?

42000 £
58000 £
520000 £

Payables days

—

This browser cannot run the calculation (Web Workers are unavailable).

Reference

Typical payables days by industry

Retail (grocery)

Typical range (days)
15–25
What drives it
High volume, fast turnover; suppliers demand quick payment

Manufacturing

Typical range (days)
30–50
What drives it
Longer production cycles; some negotiating room

Technology (hardware)

Typical range (days)
40–70
What drives it
Component suppliers often extend credit to secure orders

Construction

Typical range (days)
45–90
What drives it
Project-based billing; payments tied to milestones

Utilities

Typical range (days)
20–35
What drives it
Regulated; stable cash flow allows prompt payment

Restaurants

Typical range (days)
10–20
What drives it
Perishable goods; suppliers require fast settlement

These are rough guides. Always compare a company to its direct competitors, not to the whole industry average.

Check yourself

Check your understanding with these calculations and interpretations.

1Numeric answerChecked instantly

BrightPath Electronics has average accounts payable of £85,000 and cost of goods sold of £620,000. What is its payables days? Round to one decimal place and include the unit (e.g., '45.2 days').

Graded on Computes average payables correctly · Applies the formula with 365

2Short answerMarked by AI

A company's payables days rose from 38 to 72 over two years while its cost of goods sold stayed flat. Its cash balance dropped by 40% in the same period. What does this combination suggest about the company's financial health? Name at least two possible explanations and state which one is more likely given the cash drop.

Graded on Identifies cash strain as the primary explanation · Names at least two possible explanations · Uses the cash drop to weigh the explanations

3Short answerMarked by AI

Company A has payables days of 25 and a cash conversion cycle of 10 days. Company B has payables days of 60 and a cash conversion cycle of 45 days. Both operate in the same industry (typical payables days: 30–40). Which company is in a stronger cash position? Justify your answer by referencing both ratios.

Graded on Correctly identifies the stronger company · Uses payables days to support the choice · Uses cash conversion cycle to support the choice

Lesson 44

Cash conversion cycle

Combines inventory, receivables and payables days to show how many days of cash are tied up in operations from purchase to collection.

15 min3 assessments

You already know how fast inventory sells and how quickly customers pay. But those numbers alone don't tell you how long your cash is actually tied up. The cash conversion cycle (CCC) answers that: it's the number of days between paying for raw materials and receiving cash from customers.

CCC combines three ratios:

  • Days Inventory Outstanding (DIO) – how long inventory sits before it's sold.
  • Days Sales Outstanding (DSO) – how long it takes customers to pay.
  • Days Payables Outstanding (DPO) – how long you delay paying suppliers.

Formula: CCC = DIO + DSO – DPO

Example: A company has DIO = 40 days, DSO = 30 days, DPO = 25 days. CCC = 40 + 30 – 25 = 45 days. That means from the moment cash leaves to pay suppliers until cash arrives from customers, 45 days pass. The shorter this cycle, the less cash is tied up in operations. A negative CCC means you collect cash before you pay suppliers – a sign of strong bargaining power, but also a risk if suppliers demand faster payment.

The cash conversion cycle: days from paying suppliers to collecting from customers.

Analogy

Think of running a lemonade stand. You buy lemons and sugar on credit from a supplier, agreeing to pay in 10 days. You make lemonade and sell it to friends on credit, asking them to pay in 15 days. The time between paying your supplier (day 10) and getting paid by your friends (day 15) is your cash conversion cycle – 5 days. If you could make your friends pay faster or your supplier wait longer, your cycle shrinks and you need less cash to keep the stand running.

Where the analogy breaks down

In a real business, you have multiple suppliers with different terms, discounts for early payment, seasonal demand swings, and partial payments. The simple formula assumes all transactions are evenly spread, which is rarely true.

Comparing two companies

Company A:

  • DIO = 40 days
  • DSO = 30 days
  • DPO = 25 days
  • CCC = 40 + 30 – 25 = 45 days

Company B:

  • DIO = 20 days
  • DSO = 15 days
  • DPO = 10 days
  • CCC = 20 + 15 – 10 = 25 days

Company B has a shorter cycle – it frees up cash faster. But notice B also pays suppliers sooner (DPO = 10 vs 25). That might mean B lacks bargaining power or chooses to pay early for discounts. The CCC alone doesn't tell the whole story; you must also look at each component.

Common misconception

“A negative cash conversion cycle means the company is in financial trouble.”

Negative numbers usually signal something bad – losses, declining sales, or inefficiency.

What is actually true

A negative CCC means the company collects cash from customers before it has to pay suppliers. This can be a sign of strong bargaining power (e.g., Amazon, which collects from customers immediately but pays suppliers weeks later). However, it also means the company relies on supplier financing, which could turn risky if suppliers tighten terms or demand faster payment.

  • The cash conversion cycle (CCC) = DIO + DSO – DPO.
  • CCC measures the number of days cash is tied up in operations from purchase to collection.
  • A shorter CCC is generally better because it means less cash is locked in working capital.
  • A negative CCC occurs when DPO exceeds DIO + DSO, meaning you collect cash before paying suppliers.
  • CCC must be interpreted alongside its components; a short cycle driven by very low DPO may indicate weak supplier relationships.
Go deeper

Read the full Wikipedia article for more details, variations, and real-world examples of the cash conversion cycle.

Check yourself

Test your understanding of the cash conversion cycle.

1Multiple choiceChecked instantly

What does the cash conversion cycle measure?

  • AThe time between paying for inventory and collecting cash from customers
  • BThe time between selling inventory and paying suppliers
  • CThe total days of inventory held
  • DThe difference between receivables and payables
2Short answerMarked by AI

Company X has DIO of 35 days, DSO of 50 days, and DPO of 25 days. Calculate the cash conversion cycle. Is it better or worse than a company with a CCC of 40 days? Explain why.

Graded on Calculation of CCC · Comparison and reasoning

3Short answerMarked by AI

A company has a negative cash conversion cycle of -10 days. Is this necessarily a sign of financial trouble? Explain what a negative CCC implies and give a scenario where it could be healthy.

Graded on Understanding of negative CCC · Scenario for healthy negative CCC

Lesson 45

Asset turnover

Compares revenue to total assets to reveal how hard the company's asset base is working to generate sales.

10 min3 assessments

You already know the formula from the Efficiency Ratios node — Asset Turnover = Revenue ÷ Total Assets. But a formula without context is just arithmetic.

Two companies each report €100 million in revenue. Company A has €40 million in assets. Company B has €200 million in assets. Which one is making its assets sweat?

Company A: €100 M ÷ €40 M = 2.5 — every €1 of assets generates €2.50 of revenue. Company B: €100 M ÷ €200 M = 0.5 — every €1 of assets generates only €0.50 of revenue.

Company A uses its assets 5× more intensely. That is what the ratio captures: how hard the asset base works to produce sales.

A high turnover (above the industry norm) suggests efficient operations or a light-asset business model. A low turnover (below 1.0) means the company has tied up a lot of capital relative to its sales — potentially underperforming assets or a capital‑intensive industry. Because asset intensity varies wildly (grocery stores are high; utilities are low), always compare against peers or the company's own history, never against a universal benchmark.

  • Asset Turnover = Revenue ÷ Total Assets — it tells you how many euros of sales each euro of assets produces.
  • A turnover of 2.0 means €2 of revenue for every €1 of assets; 0.5 means €0.50 of revenue per €1 of assets.
  • Below 1.0 signals that the company holds more assets than it generates in annual revenue — a red flag unless capital intensity is normal for the industry.
  • Industries differ drastically: a supermarket chain may turn over 3–5×; a utility may turn over 0.3–0.5×. Always benchmark against peers.
  • Tracking the ratio year over year reveals whether asset efficiency is improving (rising turnover) or deteriorating (falling turnover).
  • The ratio combines all assets — cash, receivables, inventory, equipment — so a low ratio could hide within it a very good or very bad inventory turnover (which you already know how to compute).

A manufacturer reports annual revenue of €2,400,000 and total assets of €1,200,000. A competitor in the same industry reports revenue of €1,800,000 on total assets of €450,000. Calculate each company's asset turnover and state which uses its assets more efficiently.

  1. 1

    Asset Turnover = Revenue ÷ Total Assets

    Start with the formula. Revenue comes from the income statement; total assets comes from the balance sheet (the sum of current and non‑current assets).

1/6
Try it

Three things to discover:

  1. 1.The 1.0 threshold — set Revenue to €500,000 and drag Total Assets above €500,000. What happens to turnover when assets exceed revenue?
  2. 2.Diminishing returns — fix Total Assets at €1,000,000 and increase Revenue from €1,000,000 to €2,000,000 (turnover climbs from 1.0 to 2.0). Now increase Revenue from €4,000,000 to €5,000,000 — the jump is much smaller. Each extra euro of revenue moves the ratio less when you're already high.
  3. 3.What a very low ratio looks like — set Revenue to €300,000 and Total Assets to €2,000,000. That turnover is 0.15. Imagine being a lender: would you lend more money to a business that can barely generate sales from the assets it already has?
2000000 €
1000000 €

Asset Turnover

—

This browser cannot run the calculation (Web Workers are unavailable).

Check yourself

Check your understanding of asset turnover.

1Numeric answerChecked instantly

A retail chain reports annual revenue of £4,500,000 and total assets of £1,800,000. Calculate its asset turnover ratio. Enter your answer as a number rounded to two decimal places.

2Short answerMarked by AI

A construction company has an asset turnover of 0.4. What does this ratio tell you about how effectively the company uses its assets? Name one specific reason this ratio could be low and one action management could take to increase it.

Graded on Correctly interprets the ratio value (0.4 means less than €1 of revenue per €1 of assets) · Names a plausible specific reason for a low asset turnover · Proposes a sensible management action to improve the ratio

3Short answerMarked by AI

Company X has an asset turnover of 4.0 and a net profit margin of 2%. Company Y has an asset turnover of 0.6 and a net profit margin of 18%. Both have similar total assets. Which company do you think is healthier overall? Justify your answer by discussing the trade‑off between asset turnover and profit margin.

Graded on Recognises the trade‑off and does not dismiss either model outright · Uses the product of turnover × profit margin (ROA) to support the comparison · Considers context and limitations (industry, debt, growth) in the final judgement

Lesson 47

Earnings quality and red flags

You will be able to scan a set of statements for the common signs of aggressive accounting. Covers growing divergence between profit and operating cash flow, serial one-off items, changes in accounting policy, and related-party transactions. Prevents the error of building a valuation on earnings that are not sustainable.

35 min2 assessments

A company's net income can look healthy while its underlying business is deteriorating. Earnings quality measures how much of that reported profit is real, sustainable and backed by cash. Low-quality earnings often come from aggressive accounting: booking revenue before it's collected, capitalizing expenses that should be expensed, or manufacturing one-off gains.

You already know how to compute profitability ratios – now you need to tell whether those ratios are built on sand. The most reliable check is to compare net income with cash from operations. When the two diverge over multiple periods, something is being accrued that hasn't turned into cash yet. Other red flags include repeated 'exceptional' items, sudden accounting policy changes, and transactions with related parties. This node gives you a diagnostic framework to spot these signals before you rely on the numbers.

Diagnostic decision tree for earnings quality red flags

Decide

You are reviewing the annual report of Beta Tech (fictional). Key numbers (USD millions):

YearRevenueNet IncomeCash from OperationsTotal AssetsAR Days
20221,0001001202,00040
20231,200130802,50060
20241,500170503,00080

Also note: In 2024 Beta sold a subsidiary for $30M gain classified as 'other income'. No other non-recurring items. Accounting policies are unchanged. There are no related-party transactions disclosed.

What is the most concerning pattern in Beta Tech's numbers?

  • Earnings quality measures the sustainability and cash-backing of reported profit.
  • A persistent gap between net income and cash from operations is the primary red flag.
  • Frequent one-off items (e.g., restructuring, asset sales) may be masking the true recurring profitability.
  • Voluntary accounting policy changes should always be questioned for their impact on profit trends.
  • Related-party transactions require scrutiny for non-arm's-length pricing or undisclosed conflicts.
Check yourself

Test your ability to identify earnings quality red flags.

1Select all that applyChecked instantly

Which of the following are common warning signs of low earnings quality? Select all that apply.

  • ANet income growing at a similar pace to cash from operations over three years
  • BA change in depreciation method from straight-line to accelerated, reducing current year profit
  • CAccounts receivable growing faster than revenue for two consecutive years
  • DConsistent classification of ordinary operating expenses as 'exceptional' items
  • EA large sale of assets to a company owned by the CEO's relative at book value
2Short answerMarked by AI

Beta Tech's net income grew from 100 to 170 over three years, while cash from operations dropped from 120 to 50. Receivables doubled. No other red flags are obvious. In 2-4 sentences: (1) Explain why this pattern is a red flag for earnings quality, and (2) Recommend one specific line item in the financial statements to investigate next.

Graded on Identifies that earnings are not cash-backed uses the divergence evidence · Suggests a relevant next investigation step · Clarity and completeness

Lesson 48

Profit vs operating cash flow

A persistent gap between net income and cash from operations is the classic sign that earnings are being booked before cash arrives.

15 min4 assessments
Decide

You are analyzing a mid-sized manufacturer. The income statement shows net income of $12M, up 20% from last year. The cash flow statement shows operating cash flow of $1.5M, down from $4M. The CEO says "record profits." You are not so sure. Start the diagnosis.

What is your first move?

Net income and operating cash flow tell different stories about the same business. Net income records revenue when it is earned, not when cash arrives. Operating cash flow tracks actual cash moving in and out. A persistent gap between them is the classic sign of earnings booked before cash arrives.

The quality ratio (operating cash flow ÷ net income) measures this gap. A ratio consistently below 1.0 means the company is reporting profit it has not collected. Over time, this catches up — either receivables get collected, or they turn into bad debts.

You can already spot the divergence from the Earnings Quality and Red Flags node. Now you need to diagnose why. The three main causes are:

  1. 1.Accounts receivable growing faster than sales — customers are paying slower or revenue is being recognized too early.
  2. 2.Inventory building — cash is tied up in unsold goods that have not yet been expensed.
  3. 3.Accounts payable shrinking — the company is paying suppliers faster than it is collecting from customers.

Each cause points to a different problem. Fast-growing receivables suggest aggressive revenue recognition. Inventory buildup could mean obsolescence or slowing demand. Shrinking payables might indicate lost supplier confidence or tighter credit terms.

Decision tree for diagnosing a profit-cash gap

  • The quality ratio (operating cash flow ÷ net income) quantifies the gap between profit and cash generation.
  • A quality ratio consistently below 1.0 indicates earnings are being booked before cash is collected.
  • Accounts receivable growing faster than sales is the most common cause of a NI > CFO gap.
  • Inventory buildup ties up cash without affecting net income until the goods are sold.
  • Shrinking accounts payable can compress operating cash flow even when the business is profitable.
  • Large non-cash items (depreciation, gains on asset sales) create a one-time gap that is less concerning than a persistent trend.
Common misconception

“If the company reports a profit, it must have the cash to show for it.”

In personal finance, your income and your bank balance are closely linked — if you earn money, you usually have it.

What is actually true

Accrual accounting records revenue when earned, not when cash arrives. A company can show $10M in profit while operating cash flow is negative if customers have not paid yet.

Checklist
0/6

Diagnosing a profit-cash gap

Work through these in order. The trend tells you whether to worry; the working capital accounts tell you where.

Check yourself

Check your understanding of the profit-cash gap.

1Short answerMarked by AI

A company reports net income of $15M and operating cash flow of $3M for the third consecutive year. Accounts receivable have doubled from $5M to $10M over the same period. What does the quality ratio tell you, and what is the most likely cause? Suggest one specific next step for investigation.

Graded on Identifies the quality ratio and what it indicates · Identifies the most likely cause from the data · Suggests a relevant next step for investigation

2Put in orderChecked instantly

Put these diagnostic steps in the correct order when you spot a gap between net income and operating cash flow.

  • ACalculate the quality ratio for each year
  • BCheck accounts receivable days outstanding
  • CCompare NI and CFO trends over 3+ years
  • DCheck inventory turnover
  • ECheck accounts payable days outstanding
  • FIdentify non-cash items in net income
3Select all that applyChecked instantly

Which of the following could explain a persistent gap where net income exceeds operating cash flow? (Select all that apply.)

  • AAccounts receivable growing faster than sales
  • BInventory buildup over multiple quarters
  • CThe company issued new shares to raise capital
  • DAccounts payable shrinking as a percentage of cost of goods sold
  • EThe CEO received a large performance bonus
  • FDepreciation expense decreased significantly
4Multiple choiceChecked instantly

Quality ratio = Operating cash flow ÷ Net income. A ratio of 0.6 means:

  • AFor every $1 of profit, the company generated $0.60 in operating cash.
  • BFor every $1 of cash, the company generated $0.60 in profit.
  • CThe company's profit is 60% higher than its operating cash flow.
  • DThe company's operating cash flow is growing at 60% per year.

Lesson 49

Serial one-off items

Frequent 'exceptional' charges or gains suggest the real recurring earnings are being obscured by items management labels as unusual.

12 min3 assessments
Common misconception

“只要公司在损益表中将某项费用标记为‘非经常性’或‘特殊’,我就可以在分析可持续收益时放心地忽略它。”

会计准则要求单独披露非经常性项目,并且分析师通常建议调整异常项目,所以标记本身似乎是权威的认定。

What is actually true

真正的一次性项目很少频繁出现。如果同一类‘特殊’费用每年都出现(例如重组费用连续五年),它实际上是经营成本的一部分。忽略它会高估可持续收益,因为公司每年都会承担类似支出,且金额稳定。

判断一项特殊项目是否真的非经常性,关键看它出现的规律。以下是真·一次性项目与序列化一次性项目的对比,帮助你在阅读报表时准确处理。

真·一次性项目

出现频率
5年以上才出现一次
与核心业务关系
确实与主营业务无关(如地震损失、资产被征收)
对趋势分析的影响
从盈利中剔除,以反映潜在趋势

Best for 隔离非经常性冲击对盈利的影响

序列化一次性项目

出现频率
每年或每两年出现一次,金额相对稳定
与核心业务关系
往往与持续经营相关(如反复发生的重组费用、诉讼和解成本)
对趋势分析的影响
应作为经常性费用计入,否则趋势分析会掩盖恶化

Best for 揭露管理层平滑利润或隐藏业绩下滑

ABC 公司的“非经常性”重组费用

ABC 公司过去五年的净利润和重组费用如下(单位:百万美元):

年份净利润重组费用(标注为非经常性)
202010030
20219528
20229032
202311035
202410533

若直接看净利润,ABC 表现稳定(90–110)。但若将重组费用视为真实成本,调整后净利润为: 2020: 70, 2021: 67, 2022: 58, 2023: 75, 2024: 72 趋势明显下降(从70降至58再微升至72),且波动更小——重组费用实质上是每年固定的运营开支。

结论:连续出现的“非经常性”费用就是经常性费用。调整后的盈利才是可持续盈利的合理估计。

Check yourself

检验你对序列化一次性项目的理解。

1Multiple choiceChecked instantly

一家公司连续三年报告‘销售资产收益’各为 50 万、48 万、52 万,且每笔收益都被标注为‘非经常性’。你应该如何处理这些收益?

  • A全部剔除,因为它们是非经常性收益。
  • B保留在净利润中,但单独披露其趋势。
  • C视为经常性收益,因为它们每年稳定出现。
  • D只看最近一年的收益,忽略前两年。
2Select all that applyChecked instantly

以下哪些迹象表明一家公司的‘一次性项目’可能是序列化的?(选择所有适用的)

  • A项目名称每次相同,例如‘重组费用’
  • B金额每年在类似范围内波动
  • C项目在招股书中被强调为‘非经常性’
  • D公司所在行业从未发生过类似项目
  • E项目出现频率为每年一次,持续多年
  • F项目金额占净利润的比例逐年大幅下降
3Short answerMarked by AI

XYZ 公司过去四年的‘一次性费用’分别为 120 万、115 万、125 万、118 万。请说明你是否相信这些费用是真正的非经常性项目,并给出两点理由。

Graded on 判断结论的明确性 · 频率分析质量 · 金额稳定性分析 · 表达清晰与逻辑性

Lesson 50

Accounting policy changes

Changes in depreciation, revenue recognition or inventory methods can flatter the trend; ask whether the new policy is genuinely more accurate.

12 min3 assessments

Accounting policy changes are one of the most common red flags in financial statements. When a company changes how it recognizes revenue, values inventory, or depreciates assets, it resets the baseline. The previous year's numbers are restated to make the current year look like a continuation – but the change itself can hide a deteriorating trend. You already know that a growing gap between profit and cash flow warns of trouble. Now add this: a sudden change in depreciation method, from straight-line to accelerated, can reduce the current year's depreciation expense and inflate net income. The question is always: is the new policy genuinely more accurate, or is it just flattering the trend?

How an accounting policy change can obscure trends

Analogy

Think of a runner who measures the race distance in kilometers one year and miles the next. Their time suddenly looks better, but the race wasn't actually shorter – the measurement changed. The break is that in accounting, the new policy is supposed to be a better representation of economic reality, not just a different unit. The runner analogy breaks because accounting changes are not arbitrary; they are meant to improve accuracy, but sometimes they are used to mislead.

Where the analogy breaks down

Accounting changes are not arbitrary; they are intended to improve representation of economic reality, whereas changing units in a race does not improve accuracy.

Common misconception

“All accounting policy changes are attempts to manipulate earnings.”

Many high-profile fraud cases involve deliberate changes to inflate profits, and the effect on earnings is often significant.

What is actually true

Many changes are mandatory (new standards) or voluntary and legitimate (better matching of expenses to revenue). The red flag is a change that conveniently boosts current earnings without a clear operational justification.

  • An accounting policy change resets the baseline; prior years are restated, making the new trend appear seamless.
  • A change that increases current-year net income relative to the old policy is a possible red flag.
  • Always read the footnotes: the company must disclose the nature of the change, the justification, and the effect on each line item.
  • Compare the reported profit to what it would have been under the old policy – the difference is the 'adjustment'.
  • Voluntary changes that boost earnings are more suspicious than mandatory changes imposed by accounting standards.

Depreciation method change at ABC Corp

ABC Corp switches from straight-line (SL) to double-declining-balance (DDB) for its equipment. Under SL, annual depreciation is $100,000. Under DDB, it's $160,000 in year 1, then decreasing. The company reports net income of $500,000 under the new policy. But if they had kept SL, net income would have been $560,000 (because depreciation is $60,000 lower). The policy change actually reduces reported profit – not a red flag. However, if the company had switched from DDB to SL, the opposite would occur: depreciation would drop, inflating income. That's the red flag to watch for.

Check yourself

Test your understanding of accounting policy changes as a red flag.

1Multiple choiceChecked instantly

Which of the following best describes the primary reason an accounting policy change is considered a red flag for earnings quality?

  • AIt always indicates that the company is hiding losses.
  • BIt resets the baseline, making it harder to compare trends year over year.
  • CIt is illegal under generally accepted accounting principles.
  • DIt increases the company's tax liability.
2Short answerMarked by AI

A company changes its revenue recognition method from recognizing revenue at delivery to recognizing it upon customer acceptance. The change increases this year's revenue by $2 million. Explain why this might be a red flag and what additional information you would look for in the footnotes to determine if it's a legitimate improvement.

Graded on Identifies the red flag and its relation to earnings quality · Describes specific footnotes to examine · Evaluates the legitimacy of the change

3EssayMarked by AI

Imagine you are an analyst reviewing two companies. Company A changed its inventory valuation method from FIFO to LIFO during a period of rising costs, which reduced its reported profit. Company B changed from straight-line to accelerated depreciation, which increased its reported profit. Evaluate which change is more likely a red flag and why. In your answer, discuss the effect on trend comparability, the role of footnotes, and how you would adjust your analysis to account for the change.

Graded on Identifies the more suspicious change and explains why · Discusses the role of footnotes and trend comparability · Proposes a method to adjust analysis for the change

Lesson 52

Revenue recognition red flags

Recognising revenue before delivery, or boosting it with one-off contract terms, is a common way to inflate growth; check the policy note.

15 min3 assessments

Revenue is the one line a manager can move with a journal entry. Book a sale before the customer actually has the goods, and the income statement shows growth that cash flow will never confirm. That's why the revenue recognition policy note is the first place to look when profit and operating cash flow diverge — the pattern you learned to scan for in "Earnings quality and red flags".

Under accrual accounting, revenue is recognised when the performance obligation is satisfied: the customer obtains control of the goods or service. Control usually means delivery and acceptance, not the invoice date and not the day cash arrives. The policy note tells you which moment the company uses. Read it for three things: when revenue is booked (shipment? delivery? acceptance?), whether returns are estimated, and whether any revenue is reported gross rather than net.

The red flags all share one shape: revenue is recognised before control transfers, or in an amount that includes something the company never truly earned. Once you know the shape, the rest is naming the pattern and checking the trail it leaves in receivables, inventory and cash flow.

Common misconception

“If a company has recorded revenue, the cash must have come in — so the sale is real.”

In everyday life a sale happens when you hand something over and get paid; invoice and cash feel like the same moment.

What is actually true

Accrual accounting separates earning from cash. Revenue is recognised when control transfers, which can be weeks before or after cash moves. A receivable is not cash, and a booked sale to a customer with a right of return is not a completed sale. The red flag is revenue booked before control transfers — not cash arriving late.

When revenue looks too good, name the pattern before you dig. Three patterns cover most recognition red flags; each leaves a different trail.

Early delivery / channel stuffing

Policy note tells you
Revenue booked at shipment, even to distributors who can return goods
Cash-flow signature
Receivables grow faster than revenue; operating cash flow lags
Where it hides
Quarter-end spikes in sales to distributors
Decisive next check
Compare shipping dates with revenue dates; read the return-rights clause

Best for When revenue growth is strong but cash conversion is weak and receivables are ballooning.

Bill-and-hold

Policy note tells you
Customer has title but goods stay in the seller's warehouse
Cash-flow signature
Inventory stays high while revenue rises; no shipment leaves
Where it hides
Large order dated just before period end, goods still on site
Decisive next check
Verify the customer requested the delay, goods are separate and ready, delivery is scheduled

Best for When a big order appears in the last days of the period and the warehouse isn't emptying.

Round-trip / side deals

Policy note tells you
Revenue shown gross, with a related party or a buy-back promise
Cash-flow signature
Cash flows in and out roughly offset; net cash unchanged
Where it hides
Revenue and cost of goods sold jump together; gross margin flat
Decisive next check
Read the related-party note and ask what the customer actually bought

Best for When revenue jumps but gross margin stays flat and a related party is involved.

Atlas Manufacturing: the $2M shipment that wasn't

Atlas's income statement looks strong. Revenue is $12.0M, up from $10.0M — 20% growth. Net income is $1.8M. But operating cash flow is only $0.4M, down from $1.5M, and receivables rose $2.2M. Prior year net income was $1.2M.

The policy note says: "Revenue is recognised when goods are shipped and the customer has accepted them." On December 28, Atlas recorded a $2.0M order for goods shipped January 15. The customer has a right to return until March.

Restate December:

  • Revenue without the early order: $12.0M − $2.0M = $10.0M — flat year over year, not up 20%.
  • Cash conversion: $0.4M ÷ $1.8M = 22%, versus $1.5M ÷ $1.2M = 125% the year before.
  • The $2.0M sits in accounts receivable for a sale that hadn't shipped.

The tell is the mismatch: the policy note promised "shipped and accepted", but the December entry was neither. One journal entry created $2.0M of apparent growth. The cash flow statement never confirmed it.

Check yourself

Check yourself before you move on.

1Select all that applyChecked instantly

Which of the following are revenue recognition red flags? Select more than one.

  • ARevenue booked before the customer takes control of the goods.
  • BA full shipment to a distributor who has the right to return unsold units, recognised in full at shipment.
  • CA one-off gain from selling a factory reported in "other income".
  • DDeferred revenue growing because customers pay in advance for subscriptions.
  • EA bill-and-hold sale where the customer requested the delay and the goods are separately identified and ready.
2Short answerMarked by AI

A company reports revenue up 25%, operating cash flow down 10%, and accounts receivable up 40%. The policy note says revenue is recognised when goods are shipped. You find a $1.5M order shipped on January 2 but recorded as December revenue. Name the red flag, identify the two statement items that would confirm it, and state the restated revenue if total reported revenue was $10M.

Graded on Names the red flag · Identifies confirming statement items · Computes restated revenue

3Multiple choiceChecked instantly

Which condition makes a bill-and-hold sale legitimate under accrual accounting?

  • AThe customer signed a contract before the end of the reporting period.
  • BThe seller needs to free up warehouse space.
  • CThe customer requested the delay, the goods are separately identified and ready, and delivery is scheduled.
  • DThe invoice is dated before the end of the reporting period.

Lesson 53

Capstone: analyse a real company from its annual report

You will pick a listed company, download its latest annual report, and produce a written assessment of its financial health covering profitability, liquidity, efficiency and earnings quality, backed by the ratios and cash flow analysis from the course. Prevents the habit of forming an opinion from a single number.

90 min3 assessments
  • You will apply every ratio and concept from the course to a real company's annual report.
  • The goal is a written assessment of financial health covering profitability, liquidity, efficiency, and earnings quality.
  • You must support every conclusion with at least two years of data — one snapshot is not enough.
  • Operating cash flow must be checked against reported profit to detect earnings quality issues.
  • The exercise is open‑book: use all notes, management commentary and auditor statements you find.
  • Your final report should be readable by someone who has never seen the company's financials.
Steps
0/8

Follow these steps to obtain a real annual report, extract the numbers and build your analysis.

  1. Pick a company

    Choose a publicly traded company you are interested in. For this walkthrough we use Apple Inc., listed on NASDAQ as AAPL. Go to investor.apple.com or use the SEC EDGAR database (sec.gov) to find the latest 10‑K annual report.

    Avoid companies that just went public — less than 3 years of data make trend analysis unreliable.

    You have a PDF of the annual report with the full balance sheet, income statement and cash flow statement for the past two fiscal years.

  2. Extract key statements

    From the report, copy the balance sheet, income statement and statement of cash flows for the two most recent fiscal years into a spreadsheet or a notebook. Keep the same row layout.

    Your extracted data matches the PDF numbers to the last reported decimal.

  3. Compute liquidity ratios

    Calculate the current ratio (current assets ÷ current liabilities) for each year. Also compute quick ratio ((current assets – inventory) ÷ current liabilities). Enter them in your analysis.

    Use the figures from the balance sheet only — do not mix in estimates from the notes.

    Both ratios are computed and recorded with their year labels.

  4. Compute profitability ratios

    Calculate gross margin (gross profit ÷ revenue), operating margin (operating income ÷ revenue) and net profit margin (net income ÷ revenue) for each year. Also compute Return on Equity (net income ÷ shareholders' equity) and Return on Assets (net income ÷ total assets).

    All five ratios are recorded for both years.

  5. Compute efficiency ratios

    Calculate asset turnover (revenue ÷ total assets), inventory turnover (COGS ÷ average inventory) and days sales outstanding (accounts receivable ÷ (revenue/365)).

    Average inventory is (beginning + ending) ÷ 2. You may need last year's balance sheet for beginning inventory.

  6. Analyse cash flow

    From the cash flow statement, note operating cash flow, investing cash flow and financing cash flow for both years. Compute operating cash flow ratio (operating cash flow ÷ current liabilities). Compare net income to operating cash flow: is operating cash flow consistently higher?

    You have identified the trend and any significant divergence between profit and operating cash flow.

  7. Check earnings quality

    Scan the income statement for unusual items: large write‑offs, restructuring charges, asset sales gains. Compare them to revenue and net income. Note any change in accounting estimates or policy.

    If you find a large one‑off gain, investigate what caused it — is it sustainable?

    You have listed any one‑off items and your judgment on their impact.

  8. Write your assessment

    Structure your report: executive summary → profitability analysis → liquidity → efficiency → earnings quality → conclusion. Use your computed ratios and the cash flow analysis to support every claim. Cite specific numbers and years.

    The report includes at least 6 ratios (current, quick, gross margin, operating margin, ROE, asset turnover) and a cash flow comparison.

Project

Analyse a real company from its annual report

You are a financial analyst at a small investment firm. Your supervisor asks you to assess the financial health of a publicly traded company of your choice using its latest annual report (10‑K). Deliverable: a written report (800–1200 words) that covers:

  1. 1.Profitability – gross margin, operating margin, net margin, ROE, ROA.
  2. 2.Liquidity – current ratio, quick ratio.
  3. 3.Efficiency – asset turnover, inventory turnover (if applicable), DSO.
  4. 4.Earnings quality – compare net income to operating cash flow, note any one‑off items.
  5. 5.Cash flow overview – sources and uses of cash.
  6. 6.Overall assessment – healthy, cautionary, or troubled? Justify with data.

Constraints:

  • Use data from the two most recent fiscal years.
  • All ratios must be clearly calculated (show the formula and the numbers).
  • Include a short paragraph explaining why you chose that company.
  • Cite the page numbers of the annual report where you found each statement.
  • Submit as a single PDF or markdown document.

Deliverables

  • 01Written report (800–1200 words) containing the six sections above.
  • 02A separate sheet (or appendix) listing each ratio formula and the values used for both years.
  • 03A one‑sentence answer to: 'Would you recommend buying this company's stock based on your analysis?' – supported by your findings.
1Multiple choiceChecked instantly

Which of the following patterns most strongly suggests earnings quality is poor?

  • ANet income grows 15% while operating cash flow grows 12%.
  • BOperating cash flow exceeds net income in both years.
  • COperating cash flow declines for three consecutive years while net income rises.
  • DThe company invests heavily in new equipment, reducing free cash flow.
2Short answerMarked by AI

For the company you analysed, list two specific one‑off or unusual items you identified from the income statement (if any). For each, explain how it affected the reported net income and whether you consider it sustainable. If you found no unusual items, explain why you believe the earnings quality is clean.

Graded on Identification of unusual items · Analysis of sustainability

3ProjectMarked by AI

Submit your completed financial health report (800–1200 words) following the project brief above.

Graded on Structure and completeness · Ratio calculation accuracy · Quality of interpretation

Checklist
0/7

Final checks before submitting your report

Tick each item before you submit. If any box is unchecked, revise first.

For you · never graded

Think back to the first time you opened an annual report. What are the three most important skills you have developed that let you now understand it? How will you continue to use these skills in personal investing or professional work? Write a short paragraph for yourself (not graded).